How to value a fitness business — why membership math beats a revenue multiple
A single revenue or EBITDA multiple applied to a gym or studio ignores the revenue architecture that drives fitness transactions. Membership versus class-pack mix, multi-unit scalability, lease terms, and founder dependency on the floor determine whether a buyer prices you at 2.0× or 4.5×. Learning how to value a fitness business means normalizing EBITDA to true free cash flow, running FCFF, FCFE, and EV/EBITDA together, and reading the 2.0×–4.5× band against premium and discount drivers specific to fitness and wellness operators in 2026.
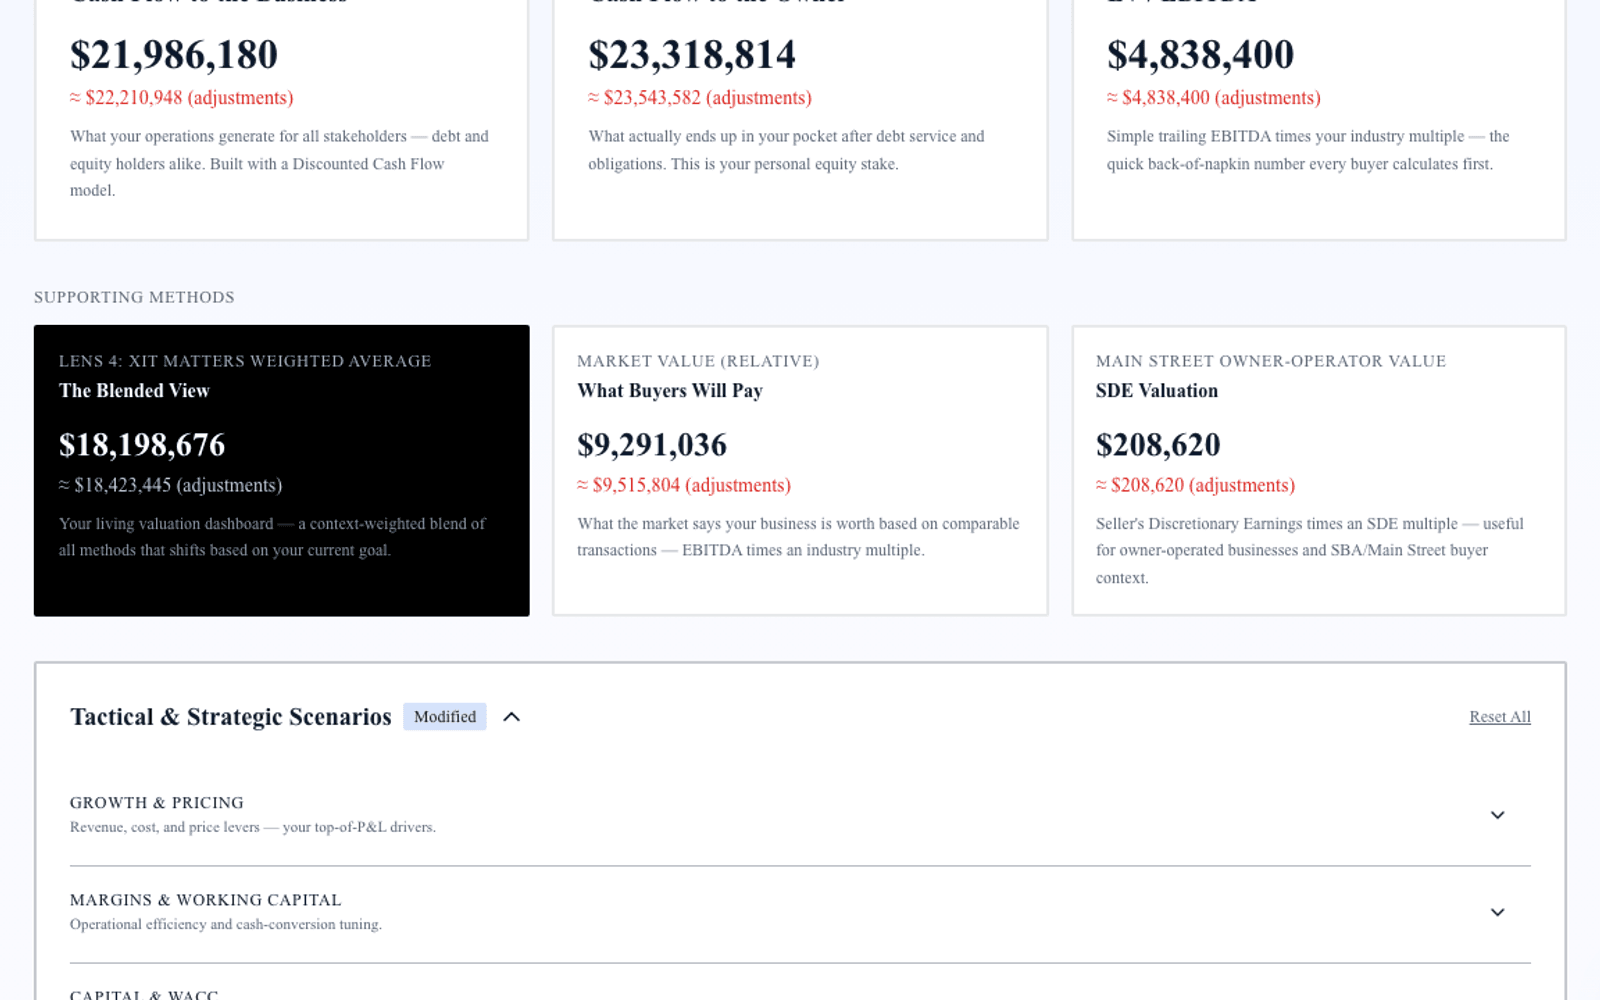
Exit Matters Chapter 7 frames the Blended View — three institutional methods weighted toward your decision. Fitness adds four complications: recurring membership quality, unit-level economics for multi-location operators, lease and build-out capex, and personality-driven brand dependency. Handle those and standard cash-flow logic applies.
The typical fitness business that transacts in the SMB market runs $500K–$8M in revenue and produces normalized EBITDA between $100K and $1.2M. Band position — not Instagram follower count — determines acquirer pricing.
Step 1 — Normalize EBITDA for a fitness business
Add back:
Owner compensation above or below market-rate regional or studio manager pay. One-time equipment or build-out costs expensed through the P&L. Non-recurring marketing blitzes or grand-opening spend. Depreciation and amortization on equipment and leasehold improvements.
Subtract:
Maintenance capex on equipment replacement — bikes, treadmills, reformers, sound systems — required to maintain current member capacity. Normalize pre-opening losses on new units if trailing twelve months include a ramp location.
Separate membership revenue from personal training, retail, and class packs in your buyer presentation. Recurring membership is the premium anchor; pack-heavy models get discounted in both FCFF and EV/EBITDA.
Step 2 — FCFF for fitness operators
FCFF = Normalized EBITDA after Maintenance Capex × (1 − effective tax rate) + non-cash charges − net working capital investment − growth capex
Working capital in fitness is lighter than manufacturing but not zero — prepaid memberships, merchandise inventory, and payroll cycles around class schedules still matter. Studios billing monthly with low churn have smoother FCFF than pack-heavy models with promotion-driven revenue spikes.
Growth capex — second location build-out, additional reformer room, digital platform — is discretionary above maintenance. Model new-unit ROI separately for expansion decisions.
Discount rates for private fitness operators typically run 14–22 percent. Multi-unit operators with documented unit economics justify the lower end; single-location personality brands justify the upper end.
Step 3 — FCFE and equity walk-away
FCFE = FCFF − interest expense × (1 − tax rate) + net debt issuance
Subtract net debt from enterprise value for equity proceeds. Factor lease economics: above-market rent functions as hidden debt; below-market lease with ten years remaining functions as hidden asset. Buyers adjust EV/EBITDA for lease terms explicitly on single-location deals.
Step 4 — EV/EBITDA market anchor for fitness
| Position | Multiple |
|---|---|
| Low (discount) | 2.0× |
| Median | 3.0× |
| High (premium) | 4.5× |
Premium drivers: Multi-location operator with proven unit economics. Recurring membership base above 70 percent. Strong digital or hybrid offering extending reach beyond physical footprint.
Discount drivers: Single-location dependency. Personality-driven brand where the founder is the product. Heavy class-pack rather than membership revenue.
At 3.0× median on $480K normalized EBITDA, enterprise value lands at $1.44M. At 4.5× for a four-unit boutique operator with 79 percent membership revenue, enterprise value reaches $2.16M.
Step 5 — Blended View for fitness owners
Weight FCFF for expansion — can unit two fund from unit one cash flow? Weight EV/EBITDA when selling to a multi-unit acquirer or franchise platform. Weight FCFE for personal walk-away after equipment and TI debt.
Run all three. Divergence often reveals lease mispricing, unnormalized new-unit losses, or membership churn not reflected in trailing EBITDA.
Franchise versus independent — how brand economics change the band
Independent studios and gyms trade on standalone unit economics, lease terms, and membership quality. Franchise locations trade with franchisor transfer fees, royalty drag on EBITDA, and brand standards that can support premium placement when the brand carries national recognition and proven ramp curves.
Franchise royalty at 7–8 percent of revenue reduces normalized EBITDA available for multiple application — buyers apply the band to post-royalty EBITDA, not gross studio margin. Transfer fees and franchisor approval timelines affect close structure. Independent operators keep full margin but carry brand-building risk that compresses multiple when the founder is the brand.
When modeling how to value a fitness business, state franchise status explicitly in buyer materials. PE platforms acquiring franchise units underwrite to franchisor unit economics; strategic buyers acquiring independents underwrite to local market defensibility and membership retention.
Personal training and ancillary revenue — normalize before applying multiples
Personal training, retail supplement sales, and apparel often represent 20–35 percent of revenue in boutique fitness. These lines carry different margin profiles and retention characteristics than core membership. Buyers price membership ARPU and churn separately from PT package revenue because PT is coach-dependent and promotion-sensitive in ways monthly dues are not.
Normalize ancillary revenue into categories with gross margin and renewal data. A studio with $840K membership revenue at 62 percent gross margin and $260K PT revenue at 48 percent margin supports higher blended EV/EBITDA than one lumping all revenue at a single margin assumption. FCFF projections built on membership-only churn curves with PT as upside scenario match how acquirers actually model fitness platforms.
Member metrics, leases, and multi-unit proof — what buyers adjust
1. Churn and auto-renew documentation. Export twelve months of membership data: joins, cancels, upgrades, freezes. Buyers model forward revenue from churn curves, not trailing averages alone.
2. Lease term and transferability. A studio with eighteen months remaining at above-market rent receives EV/EBITDA adjustment. Assignable below-market lease with eight years remaining supports premium placement.
3. Unit economics packet for multi-location operators. Same build-out cost, ramp timeline, and mature EBITDA margin across units is premium-band evidence. One strong flagship with three unproven satellites gets discounted.
4. Digital and hybrid revenue quality. Streaming or on-demand revenue with retention metrics extends addressable market; one-time digital product sales do not carry the same multiple weight as recurring digital memberships.
How XIT Matters handles fitness valuation
XIT Matters runs FCFF, FCFE, and EV/EBITDA with the fitness band (2.0× / 3.0× / 4.5×) pre-loaded. Sliders adjust recurring revenue percentage, maintenance capex, and growth visibility with instant recalculation. The AI Scenario Analyst models "What if we shift from 58% packs to 72% membership over eighteen months?" Six Persona Views cover operator, seller, and investor contexts. QuickBooks and Xero compatible. Free during beta.
Worked example — $2.9M boutique pilates operator
Revenue $2.9M across three locations, gross normalized EBITDA $520K, maintenance capex $68K, net normalized EBITDA $452K. Net debt $175K. Membership revenue 74 percent; founder teaches two flagship classes weekly but regional manager runs daily operations.
FCFF: Discounted at 16.2% WACC: enterprise value $1.7M–$2.0M.
FCFE: Equity walk-away after $175K net debt: $1.5M–$1.8M.
EV/EBITDA: $452K × 3.0× = $1.36M median; 3.9× with strong membership and three-unit proof = $1.76M.
Blended seller range: $1.5M–$1.9M enterprise. Documenting unit-level P&L and reducing founder class dependency before sale moves the blend toward 3.5×–4.0× territory.
Ramp curves and pre-opening losses on new units
Multi-location fitness operators often include one unit still in ramp within trailing-twelve-month financials. Pre-opening losses, grand-opening marketing, and sub-mature membership counts depress consolidated EBITDA relative to steady-state unit economics. Buyers strip ramp units and apply mature margin to stabilized locations — or apply a discounted multiple to ramp locations with explicit month-eighteen EBITDA targets.
Present unit-level P&L for every location: opening date, current member count, monthly churn, revenue per square foot, and EBITDA margin at maturity versus current. A portfolio with two mature units at 22 percent EBITDA margin and one ramp unit at 8 percent margin supports higher blended EV/EBITDA when ramp trajectory matches documented prior openings. Without unit-level disclosure, buyers apply conservative consolidated multiples to the entire portfolio.
Churn benchmarks and membership economics owners should track
Before you open a valuation model, export four metrics from your membership software: monthly gross churn as a percentage of opening member count, net churn after upgrades and reactivations, average revenue per member (ARPM) split by membership tier, and lifetime value divided by customer acquisition cost (LTV/CAC) on a twelve-month cohort. Buyers in fitness M&A underwrite forward revenue from these curves — not from a single trailing EBITDA number that happened to include a successful January promotion.
A studio with 4.2 percent monthly gross churn and ARPM rising quarter over quarter supports lower WACC in FCFF than one with 6.8 percent churn and flat ARPM masked by aggressive class-pack discounting. Documenting churn improvement over eighteen months — even without EBITDA growth — can move EV/EBITDA placement by half a turn because acquirers price durability of membership revenue above short-term margin spikes.
Model price increases separately from membership mix shifts. A 6 percent dues increase with 2 percent net member loss may increase EBITDA while reducing forward churn-adjusted revenue in buyer models if the price increase triggered cancellations among price-sensitive cohorts. The AI Scenario Analyst in XIT Matters handles that compound question in one query instead of rebuilding spreadsheets manually.
When to escalate to formal fitness appraisal
Engage formal appraisal or CPA-led Quality of Earnings for signed LOI diligence, SBA-backed acquisitions, franchise transfer requirements, and partnership buyouts with adversarial parties. Franchise brands may require franchisor-approved valuation ranges before ownership change approval.
Capital expenditure on studio build-outs also distinguishes fitness from pure service businesses. Tenant improvement amortization restores the income statement while cash left at lease signing — a $280K build-out on a ten-year lease adds $28K annual non-cash depreciation but the cash already departed. Buyers normalize TI spend across locations when comparing multi-unit portfolios. A operator opening unit four should model TI separately from mature units so trailing consolidated EBITDA reflects steady-state economics, not a distorted average dragged down by ramp spend.
Class schedule utilization is the operational metric buyers ask after churn. Revenue per available class hour — total class revenue divided by bookable hours — shows whether you are filling capacity or buying revenue with discount packs. A studio at 72 percent utilization with rising ARPM supports premium placement; one at 48 percent utilization with flat ARPM signals promotion dependency that compresses the multiple toward the discount end of the 2.0×–4.5× band. Track utilization monthly and present twelve-month trend in buyer materials alongside membership churn and ARPM — together they tell the utilization story acquirers underwrite.
Bottom line
How to value a fitness business in 2026 requires normalizing EBITDA after equipment maintenance capex, separating membership from pack revenue, running FCFF and FCFE for enterprise and equity views, applying the 2.0×–4.5× band with explicit recurring-revenue and multi-unit drivers, and blending all three toward your decision. XIT Matters automates that framework free during beta — ten minutes to your first answer, then model the membership and expansion moves that shift you from discount to median before a multi-unit acquirer arrives with their own unit-economics template.