Valuation calculator for consulting firms — why billings multiples misprice your methodology
If you need a valuation calculator for consulting firms, a revenue × 1.5 widget will misprice your practice before you enter last year's utilization report. Consulting firms trade on normalized EBITDA within a rational band — low 2.5×, median 3.8×, high 5.5× for typical Main-Street to lower-middle-market deals in the $500K–$15M revenue range — and your position depends on repeatable IP, multi-year client relationships, bench depth beyond the founder, and whether you still deliver every engagement personally.
Exit Matters Chapter 6 covers what buyers pay for. Chapter 7 blends FCFF, FCFE, and EV/EBITDA. Boutique strategy and management-consulting firms can clear 5×; pure staff-aug shops compress to 2.5×–3.0×. Your calculator must reflect that spread.
The 2026 consulting multiple band — 2.5× to 5.5× on normalized EBITDA
Low end (2.5×–3.2×). Hours-billed model, founder-led delivery, project mix without renewals, single-client concentration.
Median (3.8×). Documented methodology, associate bench delivering 40%+ of billable hours, renewal rates above 60%, clean financials.
High end (4.5×–5.5×). Repeatable IP licensed or productized, multi-year client relationships, bench depth beyond founder, diversified industry exposure.
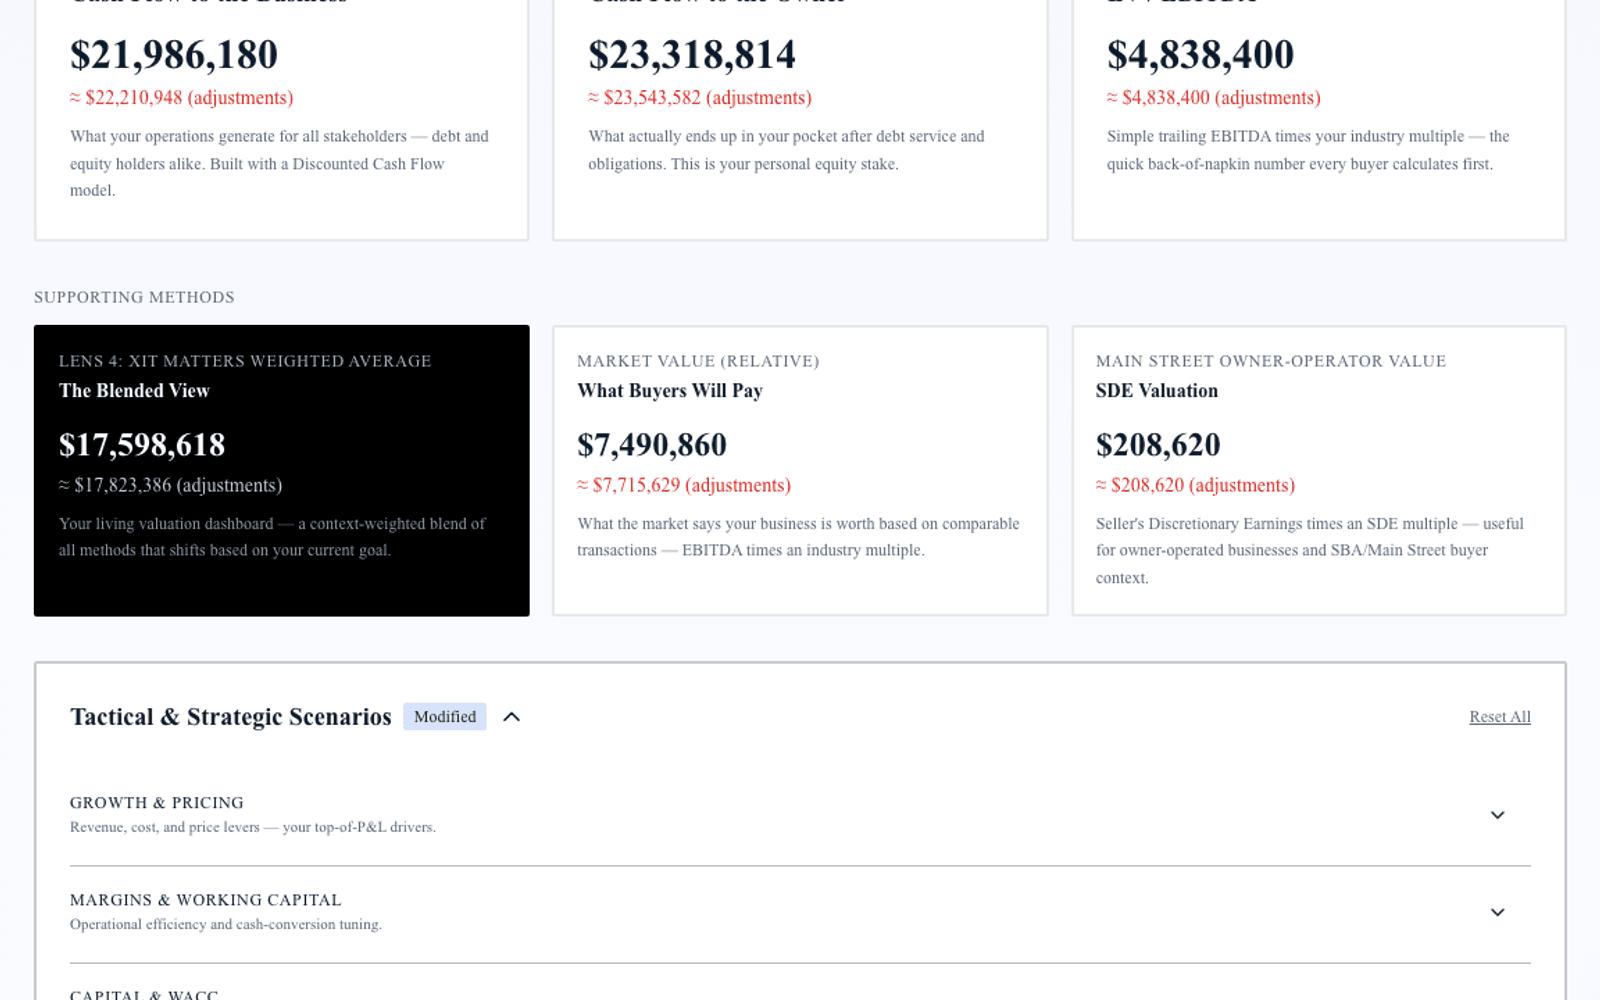
Why a single multiple is not enough — run three institutional lenses
FCFF captures unlevered cash after working-capital timing from milestone billing and receivables collection. Heavy Q4 project closeouts can inflate near-term EBITDA while FCFF lags on collection.
FCFE answers equity walk-away after partner notes or acquisition financing common in roll-up structures.
EV/EBITDA anchors to what strategic acquirers and holding companies pay in consulting roll-ups.
The Blended View shifts weight between reinvesting in IP productization versus preparing for sale to a platform buyer.
Consulting-specific levers the calculator must expose
Founder delivery hours. Model reduction from 35 to 15 billable hours per week with associate hire; key-person discount often costs a full multiple turn.
Renewal and relationship length. Multi-year relationships with documented renewal support premium; one-off project mix compresses.
Repeatable IP. Frameworks, assessments, and training products with margin above pure billable work — premium driver when revenue exceeds 20% of total.
Client concentration. Top client above 30% triggers discount. Scenario diversification before data room.
Utilization and realization. Normalize write-offs and scope creep; clean EBITDA before input.
A worked example — management consulting boutique, $3.6M revenue
Consider a management consulting boutique, $3.6M revenue, $720K normalized EBITDA, founder still delivering 28 billable hours weekly, 65% project renewal rate, top client at 24% of revenue, associate bench at 35% of delivery hours.
Generic 3.5× EBITDA yields $2.52M.
Three-method run: FCFF $2.2M–$2.7M. FCFE $2.0M–$2.5M. EV/EBITDA at 3.0×–3.6× given founder delivery implies $2.16M–$2.59M. Blended seller weighting $2.25M–$2.65M.
Highest-ROI fixes: hire senior associate pair, productize diagnostic retainer, drop founder hours below 15 — measurable before advisor fees.
Step-by-step — three-method valuation for consulting firms
Step 1 — Normalize EBITDA. Consulting normalization starts with utilization and realization. Remove non-billable founder time priced as billable, write off uncollectible receivables from legacy clients, and separate subcontractor pass-through from firm margin. Add back depreciation on minimal fixed assets.
Step 2 — FCFF mechanics. Milestone billing creates WIP and receivables swings. Normalize cash collection across trailing twelve months rather than a single heavy project-close quarter. Subtract net working capital when unbilled WIP grows.
Step 3 — FCFE for partners. Multi-partner firms require clarity on firm EV versus per-partner walk-away. Enter partnership debt, capital accounts, and any acquisition financing. FCFE answers what equity receives after obligations — critical for buyout talks.
Step 4 — EV/EBITDA placement. At 3.8× median on $720K EBITDA, enterprise value is $2.74M before founder-delivery and renewal-mix discounts. Boutique strategy with IP clears 5×; staff-aug compresses to 2.5×–3.0×.
Step 5 — Blend for consulting owners. Weight FCFF when investing in associate bench and IP productization; weight EV/EBITDA when approaching strategic acquirers or holding companies rolling up professional services.
How XIT Matters delivers a consulting firm valuation calculator
XIT Matters ships the consulting band (2.5× low, 3.8× median, 5.5× high) with premium and discount drivers visible.
Real-Time Slider Modeling adjusts owner delivery hours, renewal rate, IP revenue mix, and client concentration.
Six Persona Views for owner reinvest versus seller weighting.
AI Scenario Analyst: "What if I licensed our assessment at $15K per engagement with 40% margin?" — maps IP mix and multiple together.
Cost of Capital Simulator for buyout financing scenarios.
QuickBooks or Xero compatible or manual entry in about ten minutes. Free during beta.
Preparing consulting financials before you calculate
Two years P&L with utilization and realization reports, balance sheet, trailing cash flow. Normalize owner compensation above market principal rate, remove one-time research and conference spend, separate subcontractor pass-through from firm revenue.
When a consulting valuation calculator is enough — and when it is not
Use for partnership buyout prep, strategic sale exploration, internal wealth tracking, and prioritizing IP productization. Budget QoE or formal appraisal for signed LOI diligence, litigation, or estate filing.
Increasing consulting firm value before you sell
Fix founder delivery dependency and renewal mix first, then productize highest-margin IP. Model each fix; rank by blended delta. Eighteen months of documented bench depth often moves multiples more than hourly rate increases alone.
Partnership structures and FCFE
Multi-partner firms require FCFE modeling per equity stake, not firm-level enterprise value alone. A valuation calculator for consulting firms should clarify whether you need firm EV or partner walk-away — both valid, different conversations.
Milestone billing and WIP — consulting FCFF timing
Milestone billing creates WIP swings that affect FCFF even when P&L EBITDA looks stable. Normalize across trailing twelve months; stress-test a top-client departure scenario.
When to refresh your consulting valuation
Re-run after associate partner promotion, IP product launch, major client win or loss, or crossing $2M with 70%+ renewal rate. Quarterly refresh during exit prep.
Staff augmentation versus advisory positioning — band placement
Pure staff-aug shops compress toward 2.5×–3.0× because buyers model replacement cost and contract re-competition every renewal. Advisory and strategy positioning with fixed-fee diagnostics and retainer components support median-to-high placement when IP is documented. A valuation calculator for consulting firms must reflect that spread — enter billing model mix explicitly rather than a single revenue multiple.
Subcontractor versus employee mix — normalization before input
Heavy subcontractor reliance can inflate margin temporarily while hiding delivery risk. Normalize subcontractor spend to market rates and document which engagements require founder oversight. Buyers carve excessive subcontractor dependency in QoE; clean classification before calculator input aligns blended output with diligence reality.
Geographic and industry diversification
Single-industry client concentration — all financial services, all healthcare — compresses multiples when that sector faces headwinds. Model diversification into a second vertical with documented case studies; two verticals at 40% each often support higher band placement than one vertical at 80%.
Training products and certification revenue
Training and certification products with margin above billable delivery support premium drivers when revenue exceeds 15% of total and renewal is documented. Model launch of a certification program at fixed fee with 50% gross margin; compare blended delta against adding two junior consultants.
Succession and internal buyout — FCFE per partner
Multi-partner consulting firms need per-partner FCFE when evaluating internal buyout versus external sale. Firm-level EV divided by partnership agreement terms does not equal individual walk-away; use persona views and debt modeling to clarify each partner's number before negotiation.
Proposal win rate and pipeline quality — leading indicators
Proposal win rate and average engagement length predict renewal quality better than headline revenue growth. Track win rate by service line and enter growth visibility assumptions grounded in pipeline coverage, not optimism. A valuation calculator for consulting firms used with honest pipeline data produces ranges you can defend when a buyer asks why your forecast differs from theirs — because yours ties to documented conversion, not spreadsheet hockey sticks.
Closing note for consulting firm owners
Your practice deserves more than a billings multiple. Run the consulting band, normalize earnings, model bench and IP fixes, refresh quarterly. XIT Matters is free during beta, built from Exit Matters methodology, ready in about ten minutes. Start with normalized trailing-twelve-month EBITDA on realized revenue — buyers do. Partnership buyouts and strategic sales both start with the same question: what is normalized cash flow after the founder steps out of delivery? Answer that with FCFE and EV/EBITDA together before any term sheet, and you negotiate from strength instead of reacting to buyer-built models in diligence.
Associate leverage and realization rate — the consulting FCFF bridge
Realization rate — billed hours divided by available hours — drives consulting FCFF as much as headline utilization. When realization sits below 75% because of scope creep and unpaid rework, buyers normalize EBITDA downward. Model a 5-point realization improvement with documented scope controls; compare blended delta against a 10% rate increase that might reduce win rate. The calculator should rank operational fixes that improve realization without raising prices — often the highest-ROI path for founder-led firms preparing exit.
Conflict checks and referral network value
Referral networks and conflict-clearance processes reduce client acquisition cost for boutique firms — intangible premium drivers when documented. Firms with formal referral agreements and zero conflict incidents over three years support stronger median placement than shops relying on founder relationships alone. Capture referral percentage and document governance; buyers underwrite go-to-market durability alongside delivery bench depth.
Fixed-fee versus T&M engagements — contract structure matters
Fixed-fee engagements with documented margin profiles trade better than open-ended T&M when scope is controlled. Model a shift from 70% T&M to 50% fixed-fee productized diagnostics; watch EV/EBITDA respond when margin predictability improves. Productized fixed-fee offers also reduce founder delivery dependency when associates deliver from documented playbooks — two premium drivers in one operational change.
Partner capital accounts and buyout math
Internal buyouts require clarity on capital accounts, goodwill allocation, and non-compete terms. A valuation calculator for consulting firms produces firm-level EV; partnership agreements determine per-partner FCFE. Run firm-level blended value first, then apply partnership waterfall with your CPA before any partner conversation — the calculator gives the anchor, not the split. Document whether the buyout is asset or equity sale; tax treatment changes walk-away FCFE materially for each partner even when firm EV stays constant.
Industry headwinds and counter-cyclical positioning
Consulting firms counter-cyclical to recession — restructuring, cost reduction, compliance — may hold multiples when growth firms compress. Enter primary client industry exposure when interpreting band placement; diversified industry mix across four sectors supports premium versus single-sector dependency tied to one macro cycle. Refresh the model when your top three client industries shift — band placement moves with concentration even when total revenue looks stable quarter to quarter. Run the same discipline before annual partner compensation reviews so equity grants and bonus pools align with defensible firm value, not optimistic billings targets alone. Partners who share a single blended range from the same methodology avoid disputes that stall buyout timelines — the calculator becomes the neutral anchor when emotions run high in succession planning. Update quarterly and after any material client or partner change.