Valuation calculator for contracting businesses — why project-shop multiples misfire
If you need a valuation calculator for contracting businesses, a single “times EBITDA” guess from a broker napkin will misprice your company before you finish reconciling job cost. Contracting firms in the $1M - $20M revenue range trade on normalized EBITDA inside a rational band — low 2.5×, median 3.8×, high 5.5× — and your place on that band depends on levers generic calculators ignore: Service contracts and recurring maintenance >50%, Bonded / licensed crew bench, Commercial customer mix, versus Owner is the lead estimator and project manager, Single GC customer concentration, and Lumpy project revenue.
Exit Matters Chapter 7 frames the Blended View — FCFF, FCFE, and EV/EBITDA weighted toward the decision in front of you. Chapter 6 explains what buyers actually pay for: durable cash flow and transferable risk. Chapter 9 turns those insights into tactical levers — pricing, backlog, working capital, and key-person fixes — you can model before a sale process. Specialty contractors (HVAC, electrical, plumbing) with service revenue trade above general contractors. Your calculator must reflect that spread, not flatten every trade into one “construction” multiple.
The 2026 contracting multiple band — 2.5× to 5.5× on normalized EBITDA
Current Main-Street and lower-middle-market contracting transactions cluster into a band most owners never see until diligence.
Low end (2.5×–3.2×). Owner is the lead estimator and project manager; Single GC customer concentration; Lumpy project revenue with thin or undocumented backlog; limited bonding or licenses that sit only with the founder.
Median (3.8×). Diversified commercial mix, documented two-year financials with clean WIP, growing maintenance agreements approaching half of revenue, and a licensed crew that can execute without the owner on every site.
High end (4.5×–5.5×). Service contracts and recurring maintenance >50%; Bonded / licensed crew bench; Commercial customer mix with concentration under control; specialty HVAC, electrical, or plumbing positioning buyers can underwrite across a hold period.
Why a single multiple is not enough — run three institutional lenses
Free Cash Flow to the Firm (FCFF) captures unlevered cash after maintenance capex on vehicles, tools, and shop equipment, plus net working capital tied to under-billing, over-billing, materials, and receivables. A strong bid quarter that loads WIP can depress near-term FCFF even when EBITDA looks healthy.
Free Cash Flow to Equity (FCFE) answers equity walk-away after truck notes, equipment loans, and lines of credit supporting project float. Many contractors confuse enterprise value with cash after debt and a working-capital peg; FCFE keeps that boundary sharp.
EV/EBITDA Market Comps anchors to what strategic buyers and PE-backed platforms pay — the language brokers and sureties understand when they discuss multiples of trailing twelve-month earnings.
The Blended Valuation Engine shifts weight: FCFF-heavy for reinvesting in a service fleet or second licensed PM; EV/EBITDA-heavy when you are preparing for a platform conversation. Divergence between methods often flags WIP timing, warranty reserves, or owner-only estimating — fix those before a data room opens.
Service versus project mix — the slider that moves turns
Service and recurring maintenance revenue is the structural difference between a project shop and a transferable enterprise. When maintenance agreements and planned service exceed half of revenue, buyers underwrite retention, route density, and predictable labor utilization. When new construction and one-off renovation dominate, they underwrite bid risk, warranty callbacks, and seasonal cash swings.
A valuation calculator for contracting businesses should let you enter service percentage, average agreement length, and renewal rate, then reprice the 2.5×–5.5× band. Specialty HVAC and plumbing firms that layer service contracts on retrofit work typically sit above pure general contractors at the same EBITDA. Model a two-year push from 28% to 55% service and compare blended delta against chasing a single large GC package — Chapter 9 tactical logic often favors the service path for owners preparing exit in eighteen to twenty-four months.
Bonding, licenses, and crew bench — premium evidence buyers verify
Bonded / licensed crew bench is a premium driver because surety and municipal work cannot transfer on founder charisma alone. Document which licenses, certifications, and bonding lines survive an ownership change. If the owner holds every master license and every GC relationship, Six Persona Views under seller weighting should show compression until you hire or elevate a licensed project manager and expand bonding capacity.
Use the Cost of Capital Simulator when bonding expansion or equipment refinance changes credit spreads. Lower perceived key-person risk reduces discount rates that feed FCFF; that is often more valuable than a one-time EBITDA add-back a buyer will reverse in diligence.
GC concentration and commercial customer mix
Single GC customer concentration is a discount driver that can cost a full turn or more, even when margins look strong. Commercial customer mix — facility managers, multi-site operators, property groups — supports premium placement when no account dominates. Enter top-customer percentage and the share of revenue that is truly commercial versus residential builder-driven. Real-Time Slider Modeling should show the dollar effect of cutting the lead GC from, say, 38% to 12% while growing two facility accounts.
Do not confuse revenue size with diversification. A $9M mechanical contractor with one GC at 40% can price below a $6M specialty plumber with diversified commercial service routes. The calculator’s job is to make that comparison quantitative before you negotiate.
Backlog visibility — underwriting beyond last year’s peak job
Lumpy project revenue compresses multiples because buyers cannot see the next twelve months. Backlog visibility — contracted work, renewable maintenance, and highly probable awards — supports median-to-premium placement when documented with job schedules and agreement renewals. Enter months of visible backlog and the percentage of revenue already booked. Stress a scenario where the largest pending bid is lost; if blended value collapses, you are still a project shop in underwriting terms regardless of last year’s P&L.
A worked example — specialty HVAC contractor with service contracts
Consider a specialty HVAC contractor, $8.4M revenue in the $1M - $20M revenue range, $1.15M normalized EBITDA, 54% of revenue from service contracts and recurring maintenance, commercial customer mix across facilities and light industrial, top GC at 12% of sales, bonded crew with two licensed project managers (owner no longer bids every job), and eight months of combined service and project backlog visibility.
A generic 3.8× median guess yields about $4.37M enterprise value.
Three-method run: FCFF might land roughly $3.9M–$4.5M after vehicle and tool maintenance capex and WIP-related working capital. FCFE after equipment notes and a materials line might sit $3.5M–$4.1M. EV/EBITDA at 4.0×–4.8× given service mix and bonded bench implies roughly $4.6M–$5.52M before fine-tuning for warranty reserves. Blended under seller weighting might converge near $4.3M–$5.0M — above median because Specialty contractors (HVAC, electrical, plumbing) with service revenue trade above general contractors, and Service contracts and recurring maintenance >50% plus Bonded / licensed crew bench and Commercial customer mix are present.
Now contrast the same EBITDA with Owner is the lead estimator and project manager, Single GC customer concentration at 42%, and Lumpy project revenue with three months of backlog: EV/EBITDA can compress toward 2.7×–3.2×, cutting more than a million dollars of enterprise value without changing the tax return. Highest-ROI fixes in the calculator: protect service mix above 50%, keep top customer near the low teens, and document estimating bench — each measurable before broker engagement.
Step-by-step — FCFF, FCFE, and EV/EBITDA for contractors
Step 1 — Normalize EBITDA. Add back depreciation on vehicles and equipment. Adjust owner compensation to a market-rate operations or project-executive salary. Remove one-time tool buys, non-recurring warranty settlements, and completed-project write-offs that will not repeat. Subtract maintenance capex required to sustain current crew capacity — not discretionary fleet expansion. Separate service-agreement revenue from project revenue in the presentation buyers will see.
Step 2 — Build FCFF. Apply tax to normalized earnings after maintenance capex. Model net working capital: under-/over-billing, materials, and receivables. Contracting FCFF is rarely “EBITDA minus a plug”; WIP timing matters.
Step 3 — Derive FCFE. Subtract after-tax interest and principal dynamics on trucks, shop equipment, and credit lines. Equity walk-away equals enterprise value minus net debt adjusted for a realistic working-capital peg at close.
Step 4 — Anchor EV/EBITDA. Place the firm inside 2.5× low, 3.8× median, 5.5× high using service mix, bonding/licenses, commercial diversification, and backlog. At 3.8× on $1.15M EBITDA, enterprise value is about $4.37M before premium and discount drivers adjust placement.
Step 5 — Blend with persona intent. Weight FCFF when deciding whether to hire a second licensed PM or expand a maintenance van fleet. Weight EV/EBITDA when preparing for PE platform or strategic conversations. Use Six Persona Views so owner-reinvest and seller lenses do not get confused.
How XIT Matters delivers a contracting valuation calculator
XIT Matters ships the contracting band (2.5× low, 3.8× median, 5.5× high) with premium and discount drivers visible beside the multiple.
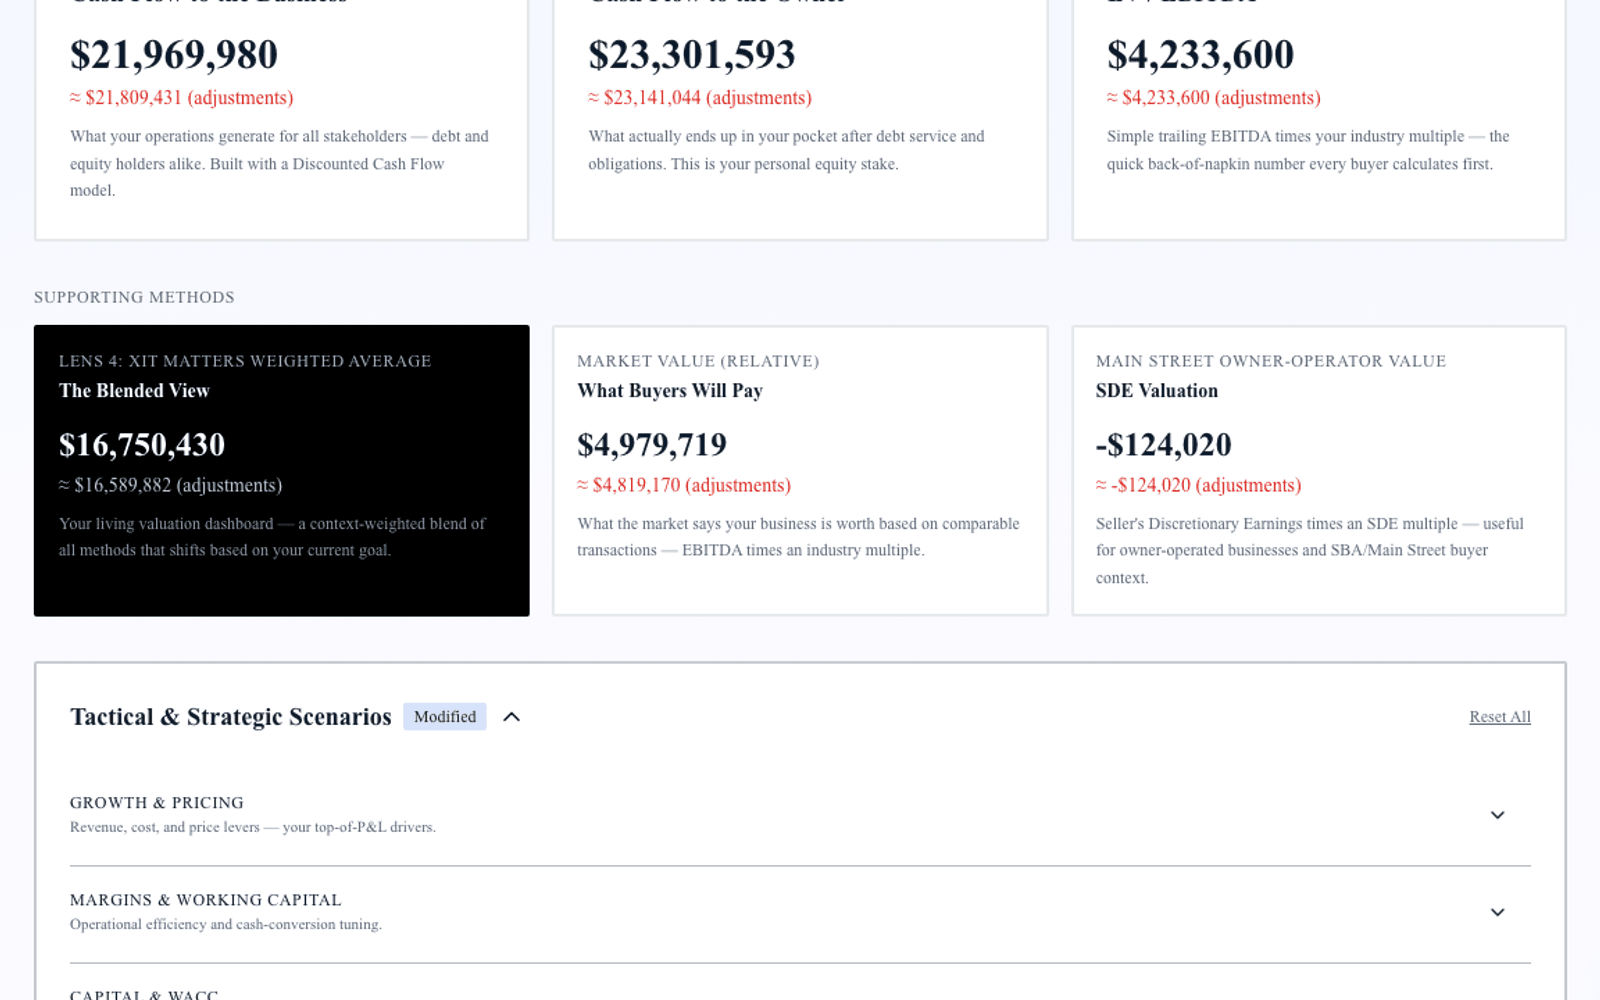
Blended Valuation Engine combines FCFF, FCFE, and EV/EBITDA into one decision range.
Real-Time Slider Modeling adjusts service mix, top-customer concentration, backlog visibility, and industry multiple position — every move recalculates all three methods.
Six Persona Views switch between owner reinvest and seller pre-market weighting.
AI Scenario Analyst accepts questions such as: “What if service contracts rose to 58% and the lead GC fell to 12%?” — mapping mix, concentration, and multiple together.
Cost of Capital Simulator exposes WACC so bonding expansion or equipment refinance flows through FCFF.
EV/EBITDA Market Comps keep the answer in the language buyers and brokers use.
QuickBooks & Xero compatible entry or manual financials in about ten minutes. Free during beta — no credit card. Built from Exit Matters. Methodology used by PE firms — FCFF, FCFE, EV/EBITDA. Ten minutes to your first valuation.
Preparing contracting financials before you calculate
Gather two years of P&L with job-cost detail, balance sheet with WIP and under-/over-billing, trailing cash flow, vehicle and equipment schedule, bonding capacity letter if available, and a schedule of service agreements versus project revenue. Normalize owner pay, remove one-time tool and warranty spikes, and document which licenses and surety lines transfer. Write down known warranty exposure before presenting numbers a Quality of Earnings team will rebuild anyway.
When a contracting valuation calculator is enough — and when it is not
Use it for sale preparation, partnership buyouts, SBA anchoring conversations, bonding capacity planning, and ranking operational fixes by blended dollar impact. Budget formal appraisal or Quality of Earnings for signed LOI diligence, litigation, estate contexts, or lender requirements that mandate a certified valuation. A calculator is a decision instrument, not a replacement for QoE or appraisal.
Increasing contracting value before you sell
Prioritize Service contracts and recurring maintenance >50%, then Bonded / licensed crew bench and Commercial customer mix, while attacking Owner is the lead estimator and project manager, Single GC customer concentration, and Lumpy project revenue. Model each fix; rank by blended delta. Eighteen to twenty-four months of documented service growth and estimating delegation often move multiples more than one oversized project win that inflates a single year.
WIP, percentage-of-completion, and calculator inputs
Percentage-of-completion timing can inflate or deflate trailing EBITDA relative to cash. Enter revenue only after you can defend completed-contract economics and WIP schedules. A valuation calculator for contracting businesses that ignores under-billing will overstate FCFF in ramp quarters and invite re-trade. Normalize trailing twelve months and disclose open jobs above a material threshold.
Warranty reserves and callback risk
Elevated callbacks signal process risk buyers normalize into earnings. Track warranty as a percent of project revenue; clean trends support median placement while rising reserves trigger discount. Fund realistic reserves before calculator input — sophisticated buyers will rebuild them.
Owner estimating dependency — quantify before you list
When the founder still writes every major bid and holds every GC relationship, seller persona views should show key-person compression even if service mix looks strong. Model hiring or promoting a senior estimator who owns jobs above a dollar threshold; compare blended uplift against a price increase on maintenance agreements. Chapter 9 tactical decisions favor transferable process over heroic owner hours.
Seasonal cash and materials float
Seasonal project spikes create materials float and receivable builds that crush FCFE in shoulder months. Stress the calculator with a slow first quarter and a materials-price spike; if debt service coverage fails, fix working-capital practices before you market the company. Cost of Capital Simulator scenarios help you see whether a larger revolver improves resilience or merely masks lumpy project revenue.
PE platform versus strategic trade buyer — weighting the blend
PE-backed mechanical platforms underwrite recurring service density, licensed bench, and geographic density. Strategic trade buyers may underwrite tuck-in crew capacity and customer overlap. Shift Blended Valuation Engine weight toward EV/EBITDA for platform processes and FCFF when deciding whether to reinvest in a second service territory versus extract dividends.
When to refresh your contracting valuation
Re-run after a major GC win or loss, bonding limit change, service-agreement cohort renewal, licensed PM hire, or crossing a revenue breakpoint where commercial mix shifts. Quarterly refresh during exit prep keeps the band honest as backlog and concentration move.
Closing note for contracting business owners
Your company deserves more than a general-contractor multiple. Run the contracting band — 2.5×, 3.8×, 5.5× — with honest service mix, bonding evidence, and GC concentration. Specialty contractors (HVAC, electrical, plumbing) with service revenue trade above general contractors; prove it in the model. XIT Matters is free during beta, built from Exit Matters methodology, QuickBooks & Xero compatible, and ready in about ten minutes to your first valuation. Start with normalized trailing-twelve-month EBITDA after maintenance capex — buyers do — then rank service, bench, and concentration fixes by blended delta before you list.