Valuation calculator for landscaping businesses — why a single multiple misprices your routes
If you need a valuation calculator for landscaping businesses, a broker napkin that multiplies last summer’s profit by “about four” will misprice your company before you finish uploading QuickBooks. Landscaping firms trade on normalized EBITDA within a rational band — low 2.5×, median 4.0×, high 6.0× for typical deals in the $500K - $10M revenue range — and your place inside that band depends on factors generic tools skip: Recurring maintenance contracts >70%; Commercial customer mix; Modern fleet with low remaining capex. Discount drivers cut the other way: One-time installation / project mix; Owner-operator dependency; High seasonality without snow / off-season service.
Exit Matters Chapter 7 frames the Blended View — three institutional methods weighted toward the decision in front of you. Chapter 9 covers tactical levers — pricing, hiring, capex, and working capital — that move earnings quality before a multiple ever applies. A valuation calculator for landscaping businesses must run FCFF, FCFE, and EV/EBITDA on normalized financials and expose those landscaping-specific drivers, not a residential mulch-season average.
Landscaping is a long-running PE roll-up; multiples have compressed slightly in 2026 vs. 2024 highs. Your calculator should reflect that cooler bid environment, not last cycle’s peak comps.
The 2026 landscaping multiple band — 2.5× to 6.0× on normalized EBITDA
Current SMB landscaping transaction data clusters into a band most owners never see until a buyer’s quality-of-earnings team rebuilds the P&L.
Low end (2.5×–3.2×). One-time installation / project mix dominates revenue. Owner still runs estimating, crew dispatch, and the top commercial relationships. High seasonality without snow / off-season service leaves winter months thin. Aging trucks and mowers with deferred replacement show up as catch-up capex in year one of a buyer model.
Median (4.0×). Documented maintenance contracts covering a clear majority of revenue, mix of commercial and residential accounts with clean two-year financials, fleet schedule that separates maintenance from growth spending, and a general manager who can run peak season without the founder on every job site.
High end (5.0×–6.0×). Recurring maintenance contracts >70%; Commercial customer mix with multi-year agreements and renewal history; Modern fleet with low remaining capex; off-season density from snow, lighting, or irrigation winterization that smooths cash flow.
Two firms at identical EBITDA can sit nearly two full turns apart when one holds three-year HOA and property-management contracts and the other lives on spring installs and Facebook leads.
Why a single multiple is not enough — run three institutional lenses
Free Cash Flow to the Firm (FCFF) projects unlevered cash after maintenance capex on trucks, trailers, mowers, and irrigation gear, minus net working capital investment. Landscaping ties cash in spring fuel and mulch inventory, prepaid insurance, and commercial receivables that often run 30–45 days — all of which flow into FCFF even when summer EBITDA looks strong.
Free Cash Flow to Equity (FCFE) answers what equity holders receive after truck notes, equipment lines, and any SBA or seller financing. Many owners confuse enterprise value with the wire at closing; FCFE keeps that boundary sharp when half the fleet still sits on loans.
EV/EBITDA anchors to what brokers, strategic buyers, and PE platforms pay — the language of landscaping M&A. The multiple adjusts for contract mix, commercial concentration quality, fleet age, and whether the owner is the only person who can sell or supervise crews.
The Blended View combines the three with weights that shift for reinvestment versus exit. Owner reinvest weighting emphasizes FCFF for route expansion and hiring; seller weighting emphasizes EV/EBITDA for platform and strategic conversations.
Maintenance versus installation mix — the first slider that moves dollars
Buyers do not pay the same multiple for a dollar of weekly commercial mowing as for a dollar of one-time patio install. Recurring maintenance revenue supports underwritable cash flow across a hold period. Project revenue spikes gross profit in peak months and then disappears — a pattern that pushes band placement toward discount drivers when One-time installation / project mix dominates.
Enter maintenance and installation percentages separately in the calculator. Model a structural shift: move from 48% recurring / 52% project to Recurring maintenance contracts >70% over eighteen months by converting install customers into annual maintenance agreements and pruning low-margin hardscape work. Watch FCFF stabilize and EV/EBITDA placement climb. That scenario often beats bidding more one-off installs at thin margin — a Chapter 9 pricing and mix decision, not a growth vanity metric.
Document average contract length, renewal rate, and cancellation history before you open a data room. The calculator can show the dollar impact; diligence will ask for the paper trail.
Fleet capex — why EBITDA alone overstates landscaping cash
Landscaping is more asset-intensive than pure professional services. A shop reporting $680K EBITDA with $130K in annual maintenance capex does not generate $680K of free cash. Buyers build replacement schedules into year-one through year-three models. Modern fleet with low remaining capex supports premium placement; deferred mower and truck replacement is among the fastest diligence haircuts after Owner-operator dependency.
In the calculator, separate maintenance capex (keep current productive capacity) from growth capex (extra crew truck for a new territory). FCFF should subtract maintenance first. Then stress-test a catch-up year: if three aging zero-turns and two dump trucks need replacement before a sale, model that spend and see how blended value compresses — better you discover it than a PE associate in week two of diligence.
Chapter 9 treats capex as a tactical lever. Sometimes paying down high-rate equipment debt or refreshing the worst three assets before listing expands FCFE and multiple placement more than adding another seasonal crew.
Seasonality, snow, and off-season density
High seasonality without snow / off-season service is a structural discount driver. Buyers underwrite idle payroll, thin January cash, and the risk that spring weather delays wipe the first sixty days of the year. Snow contracts, holiday lighting, leaf programs that extend into late fall, and irrigation winterization fill utilization gaps without requiring the same peak-season headcount.
Use Real-Time Slider Modeling to add a winter service line with documented gross margin and crew hours. Compare blended delta against buying another spring route at full fleet cost. Off-season density frequently ranks higher for owners eighteen months from a sale because it improves cash conversion in the months PE models stress most.
If you operate in a non-snow climate, the same logic applies to any contracted off-peak work — the calculator cares about utilization smoothness, not the specific service name.
PE roll-up dynamics in 2026 — cooler comps, same diligence bar
Landscaping is a long-running PE roll-up; multiples have compressed slightly in 2026 vs. 2024 highs. Platform buyers still want Recurring maintenance contracts >70% and Commercial customer mix, but they are less willing to stretch to prior-cycle peaks for undifferentiated residential install shops. A valuation calculator for landscaping businesses that still implies 2024 scarcity pricing will set you up for a re-trade.
Read calculator output as a band, not a trophy number. Earn the high end with contract documentation, a modern fleet schedule, and a management bench that survives the founder taking two weeks off mid-season. Model a PE-style haircut on owner-dependent sales and deferred fleet spend so your asking range survives first-pass diligence.
Six Persona Views help here: switch from owner-reinvest weighting to seller weighting and see how the same financials read to a platform associate versus your own hold decision.
A worked example — commercial maintenance company, $4.2M revenue
Consider a commercial grounds maintenance company: $4.2M revenue, $720K normalized EBITDA before maintenance capex, 78% recurring maintenance contracts (HOAs, office parks, and two property-management portfolios), 22% enhancement and small install work, commercial customer mix at roughly 70% of revenue, fleet average age five years with $95K annual maintenance capex need, 31-day DSO on commercial invoices, founder still closes the two largest accounts personally, no snow line in a market with mild winters.
A generic calculator might apply 4.0× EBITDA and print $2.88M.
Running three methods: FCFF might land $2.35M–$2.75M after maintenance capex and spring working-capital builds. FCFE after $310K net truck and equipment debt might sit $2.05M–$2.45M. EV/EBITDA at 3.6×–4.8× given strong recurring mix but owner-dependent top accounts implies $2.59M–$3.46M before band adjustments. Blended under seller weighting might converge $2.45M–$2.95M.
The owner sees the highest-ROI fixes in dollars, not slogans: document a second relationship owner on the top two accounts, convert enhancement customers into annual maintenance agreements to push Recurring maintenance contracts >70% with clearer paper, refresh the two oldest crew trucks before listing, and pilot a leaf-and-lighting package to cut winter idle time — each measurable in the calculator before a broker engagement letter.
Step-by-step — running FCFF, FCFE, and EV/EBITDA on landscaping financials
Step 1 — Normalize EBITDA. Start with operating income, add back depreciation, then apply landscaping-specific adjustments. Add back owner compensation above a market-rate operations manager salary. Remove one-time storm work spikes, insurance recoveries, and non-recurring legal costs. Subtract maintenance capex on trucks, trailers, and mowers required to sustain current route capacity. Separate recurring maintenance revenue from one-time installation / project mix so buyers see the contract base that supports premium multiples.
Step 2 — Build FCFF. Apply effective tax rate to normalized earnings after maintenance capex. Add back non-cash charges. Subtract net working capital investment — spring inventory and fuel builds, prepaid insurance, and commercial receivables. Model DSO explicitly; a firm at 42-day DSO with heavy March prepay has different FCFF than one at 28-day DSO with monthly maintenance billing.
Step 3 — Derive FCFE. Subtract after-tax interest on fleet loans and equipment lines. Add net debt issuance only if you are modeling refinance scenarios. Equity walk-away equals enterprise value minus net debt, adjusted for working-capital peg assumptions at close.
Step 4 — Anchor EV/EBITDA. Apply the 2.5×–6.0× band based on contract mix, commercial share, fleet condition, and seasonality. At 4.0× median on $625K EBITDA after maintenance capex, enterprise value lands at $2.5M before premium and discount drivers adjust placement.
Step 5 — Blend the three. Weight FCFF for hiring and route-expansion decisions; weight EV/EBITDA for PE and strategic processes; weight FCFE for personal walk-away after fleet debt. Divergence between methods often reveals deferred equipment spend or overstated project margin — fix those before the data room opens.
How XIT Matters delivers a valuation calculator for landscaping businesses
XIT Matters ships the landscaping band (2.5× low, 4.0× median, 6.0× high) with premium and discount drivers beside the multiple controls — Recurring maintenance contracts >70%; Commercial customer mix; Modern fleet with low remaining capex on one side, and One-time installation / project mix; Owner-operator dependency; High seasonality without snow / off-season service on the other.
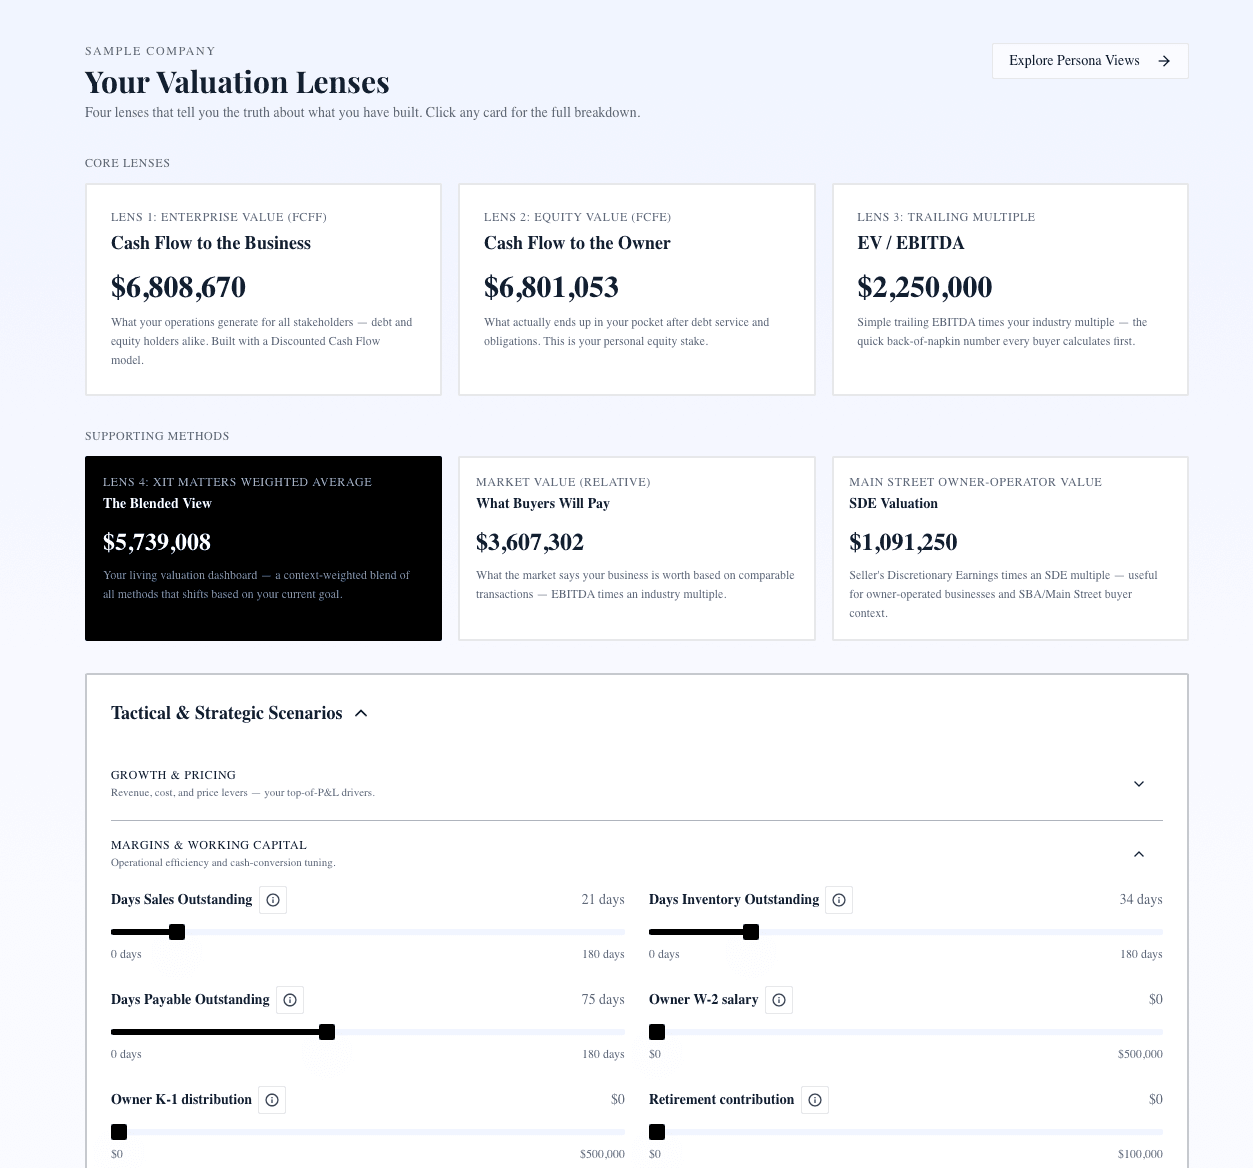
The Blended Valuation Engine runs FCFF, FCFE, and EV/EBITDA together. Real-Time Slider Modeling adjusts recurring revenue mix, growth visibility, DSO, fleet burden, and band position — every move recalculates all three methods and the blended headline. EV/EBITDA Market Comps keep the landscaping transaction band visible while you stress-test scenarios.
Six Persona Views switch between owner reinvest and seller pre-market weighting so you see the same routes through a platform buyer’s lens. The AI Scenario Analyst accepts plain-English questions such as: “What if recurring maintenance rose to 80% and we added $180K of snow revenue?” — mapping mix, seasonality, and multiple together. The Cost of Capital Simulator exposes WACC so fleet refinance and credit-spread changes flow through FCFF.
QuickBooks & Xero compatible entry or manual financials in about ten minutes. Free during beta — no credit card. Built from Exit Matters. Methodology used by PE firms — FCFF, FCFE, EV/EBITDA.
Preparing landscaping financials before you calculate
Gather two years of P&L with maintenance versus install split, balance sheet with equipment schedule and ages, trailing cash flow, and a simple fleet list with remaining useful life. Normalize owner compensation, remove storm spikes and one-time insurance events, and separate maintenance from growth capex in any packet you would hand a buyer. Pull contract renewal rates and top-ten customer concentration — commercial quality matters as much as commercial percentage.
When a landscaping valuation calculator is enough — and when it is not
Use the calculator for sale preparation, partnership buyouts, SBA anchoring, route-expansion decisions, and ranking which Chapter 9 levers — pricing on maintenance agreements, hiring a second account manager, fleet refresh, or working-capital timing — move blended value most. Budget formal appraisal or quality of earnings for signed LOI diligence, litigation, or estate contexts. XIT Matters does not replace QoE or a formal appraisal; it gets you to those conversations with a defensible institutional range.
Increasing landscaping value before you sell
Fix Owner-operator dependency and deferred fleet spend first, then push Recurring maintenance contracts >70% with commercial paper trail. Model each fix; rank by blended delta. Eighteen months of documented contract conversion and off-season density often moves multiples more than a single strong install season on aging equipment. Pricing discipline on maintenance renewals — a Chapter 9 lever — frequently beats winning more low-margin hardscape bids.
Working capital and commercial DSO — FCFF mechanics for grounds firms
Commercial property managers and HOAs rarely pay on the day the crew finishes. A valuation calculator for landscaping businesses must capture receivables and spring prepay or FCFF misstates cash in ramp months. Normalize trailing twelve months; stress-test a scenario where top commercial accounts stretch from 28 to 45 days — FCFE sensitivity often surprises owners who only watched summer EBITDA.
Hiring and crew bench — translating Chapter 9 into calculator inputs
Hiring a second supervisor or account manager is not just payroll; it is the antidote to Owner-operator dependency. Model the fully loaded cost against the multiple expansion from documented management bench. If the blended increase exceeds two years of incremental salary, the hire is an exit investment, not only an operating expense. The AI Scenario Analyst can frame that tradeoff in dollars across FCFF and EV/EBITDA.
Pricing maintenance renewals versus chasing install volume
Chapter 9 emphasizes pricing as a tactical lever. A 4% renewal increase on a $2.8M maintenance book with high retention often expands FCFF more than $200K of new install revenue at thin margin and high crew overtime. Enter both scenarios in Real-Time Slider Modeling and compare. The ranking tells you whether to protect contract yield or chase project volume before listing.
When to refresh your landscaping valuation
Re-run after major contract wins or losses, fleet refinance or catch-up replacement, adding snow or winter lines, crossing a new revenue threshold with positive EBITDA, or promoting a general manager who removes the founder from daily dispatch. Quarterly refresh during exit prep keeps broker and PE conversations current as 2026 comps continue to settle below 2024 highs.
Closing note for landscaping business owners
Your routes and contracts deserve more than a napkin multiple. Run the landscaping band — 2.5× to 6.0× for the $500K - $10M revenue range — normalize for fleet maintenance, model maintenance-versus-install mix and off-season density, and refresh as PE roll-up comps compress from prior peaks. XIT Matters is free during beta, built from Exit Matters methodology, ready in about ten minutes to your first valuation. Start with normalized trailing-twelve-month EBITDA after maintenance capex — buyers do. Tie every slider move to an operational decision you can execute this quarter: convert an install customer to annual maintenance, document a second relationship owner on your largest commercial account, refresh the worst truck before diligence, or launch a winter utilization package. A valuation calculator for landscaping businesses earns its keep when it ranks those fixes by dollar impact on blended value, not when it prints a single number you cannot defend when a platform buyer opens the data room.