How to value a landscaping business — why seasonal revenue needs institutional math
Most small-business valuation shortcuts apply a revenue or EBITDA multiple and stop. For a landscaping company, that misses half the story. Operations tie cash in fleet replacement, crew labor swings between peak season and winter slowdown, and the split between recurring maintenance contracts and one-time installation work determines whether a buyer prices you at 2.5× or 6.0×. Learning how to value a landscaping business properly means normalizing EBITDA to true free cash flow, running FCFF, FCFE, and EV/EBITDA together, and reading the transaction band against the premium and discount drivers that govern landscaping deals in 2026.
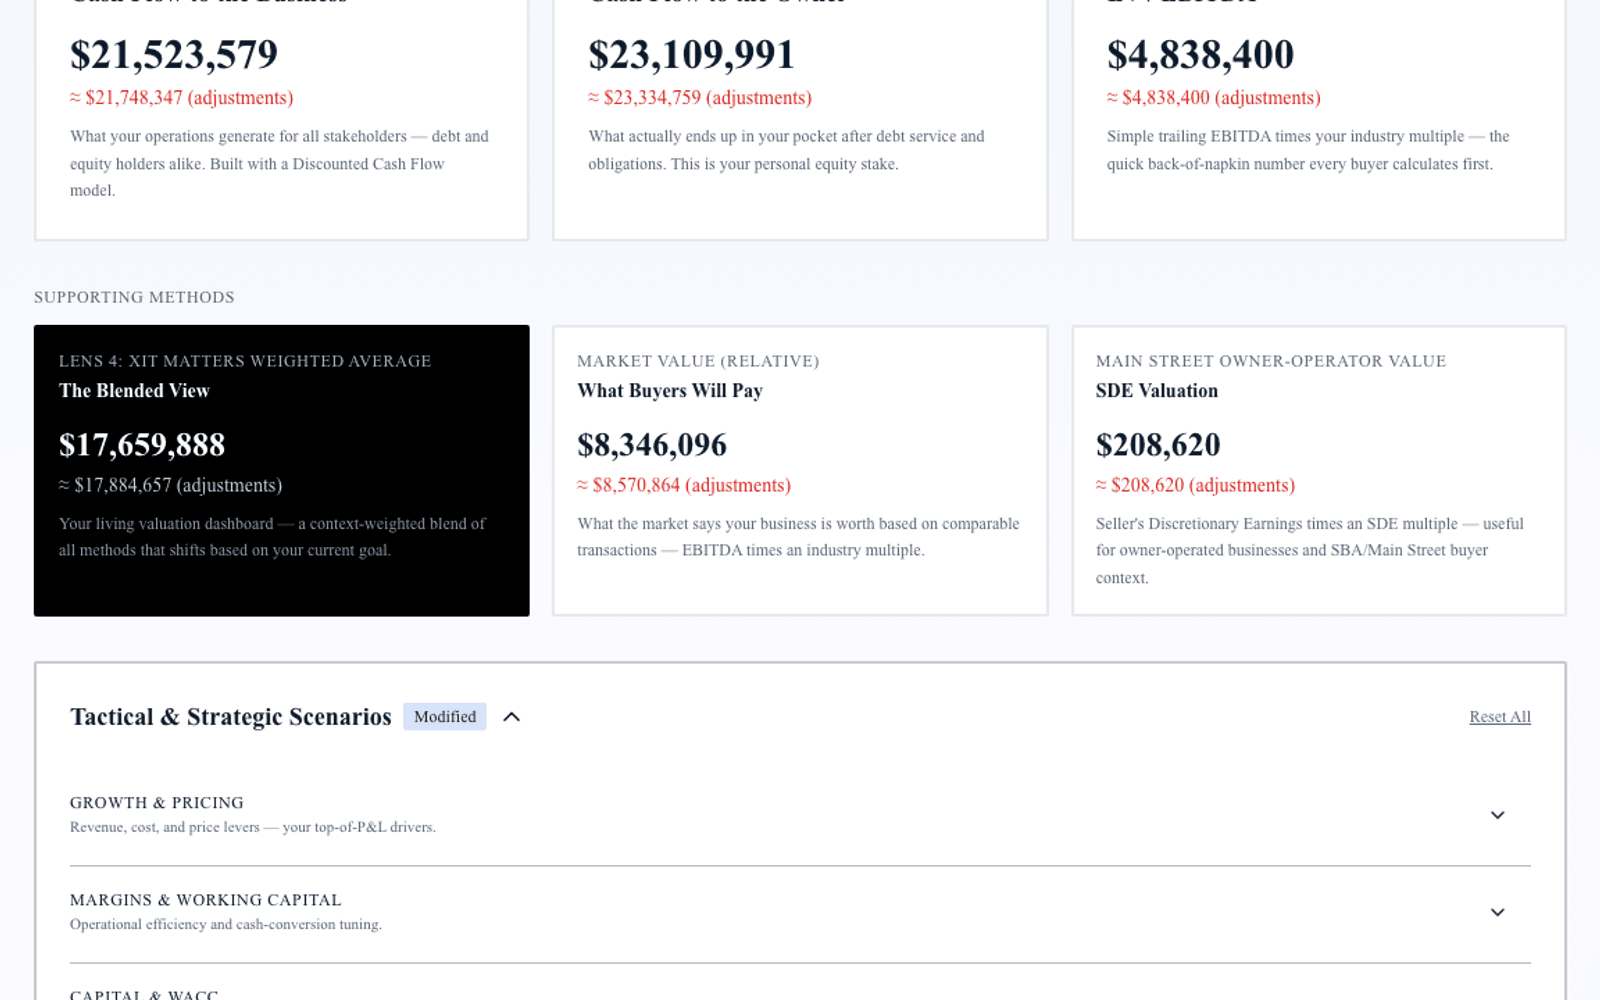
Exit Matters Chapter 7 calls this the Blended View — three institutional methods weighted toward the decision in front of you. That framework applies to any industry, but landscaping introduces four complications generic guides gloss over: recurring versus project revenue mix, fleet maintenance capex, seasonality and off-season service lines, and owner-operator dependency on crews and customer relationships. Handle those four correctly and the rest follows standard cash-flow logic.
The typical landscaping business that transacts in the SMB market runs $500K–$10M in revenue and produces normalized EBITDA between $150K and $2M. Band position — not raw EBITDA — determines whether an acquirer prices at 2.5× or 6.0×.
Step 1 — Normalize EBITDA for a landscaping business
EBITDA is the starting point, not the finish line. Landscaping-specific normalization adds and subtracts items the standard P&L obscures.
Add back to reach gross normalized EBITDA:
Owner compensation above or below a market-rate general manager or operations lead — not minimum wage on the crew roster, not a chairman salary. One-time equipment purchases expensed through the P&L rather than capitalized. Non-recurring insurance claims, legal settlements, or storm-damage spikes. Depreciation and amortization (standard add-back for all businesses). Related-party vehicle or facility charges above or below arm's-length lease rates.
Subtract to arrive at net normalized EBITDA:
Maintenance capex — the recurring annual spend required to maintain current fleet capacity: mowers, trucks, trailers, skid steers, and irrigation equipment. Use a three-year average to smooth lumpy replacement years. A landscaping shop reporting $720K EBITDA with $125K in annual maintenance capex has $595K in true cash EBITDA.
Separate one-time installation revenue from recurring maintenance when presenting to buyers. Project-heavy shops can show strong gross EBITDA in peak season while carrying thin winter months; recurring contract base is what supports premium multiple placement.
The result is Normalized EBITDA after Maintenance Capex — the number from which FCFF calculations properly begin.
Step 2 — FCFF for landscaping operators (the enterprise lens)
Free Cash Flow to the Firm measures what your landscaping operation generates for all capital providers before debt service:
FCFF = Normalized EBITDA after Maintenance Capex × (1 − effective tax rate) + non-cash charges − net working capital investment − growth capex
Working capital in landscaping follows seasonal patterns. Spring ramp ties cash in fuel, mulch inventory, and prepaid insurance while customer payment terms on commercial accounts can run 30–45 days. Model receivables and prepaid expense together — a firm running 42 days sales outstanding with heavy spring prepay has different FCFF than one at 28 days DSO with monthly billing on maintenance contracts.
Growth capex — new trucks, expanded crew capacity, additional service territory — is discretionary above maintenance. Exclude it from the FCFF baseline but model separately to show buyers what return incremental fleet investment generates.
FCFF is discounted at Weighted Average Cost of Capital. Landscaping firms with high recurring revenue and commercial mix may discount at 12–15 percent; owner-dependent residential shops with lumpy project revenue may carry 17–21 percent when concentration and key-man risk compound. The Cost of Capital Simulator in XIT Matters builds the rate from component inputs so you see what drives it.
Step 3 — FCFE and equity walk-away
FCFE strips debt service from FCFF to show actual equity cash flow — what you take home after equipment loans and lines of credit are paid.
FCFE = FCFF − interest expense × (1 − tax rate) + net debt issuance
In a sale, FCFE governs personal proceeds. Enterprise value from FCFF and EV/EBITDA establishes the top line; subtract net debt to reach equity value. A landscaping company with $2.4M enterprise value and $380K in net debt on trucks and equipment walks away with $2.02M equity — not $2.4M.
FCFE also matters before a sale. If the business generates $320K in annual equity free cash flow on $1.5M equity value, that is a 21.3% cash-on-cash return — worth comparing against reinvestment in another crew or a different capital allocation before deciding to sell.
Step 4 — EV/EBITDA market anchor for landscaping
The landscaping transaction multiple band sits at:
| Position | Multiple |
|---|---|
| Low (discount) | 2.5× |
| Median | 4.0× |
| High (premium) | 6.0× |
EV/EBITDA applies the multiple to Normalized EBITDA — ideally after maintenance capex.
Premium placement requires three or more of:
Recurring maintenance contracts above 70 percent of revenue with documented renewal rates. Commercial customer mix with multi-year agreements and property-management relationships. Modern fleet with remaining useful life and annual maintenance capex below 10 percent of EBITDA. Documented crew bench and field supervisors who operate without the owner on every route. Snow removal, irrigation, or off-season service lines that smooth winter cash flow.
Discount placement results from:
One-time installation and project mix above 50 percent without recurring anchor. Owner-operator dependency — the owner runs routes, estimates every job, and holds every key commercial relationship. High seasonality without snow, holiday lighting, or other off-season revenue. Aging fleet with deferred replacement backlog buyers must fund in years one through three.
At 4.0× median on $595K normalized EBITDA, enterprise value lands at $2.38M. At 6.0× for a premium operator with 78 percent recurring commercial maintenance, enterprise value reaches $3.57M. Understanding which band position your business occupies — and which premium drivers you are still missing — is the operating roadmap for how to value a landscaping business and improve that value before a transaction.
Step 5 — Blended View for landscaping owners
No single method tells the full story. FCFF captures intrinsic discounted cash flow but is sensitive to discount rate assumptions. EV/EBITDA anchors to market but ignores capital structure and contract quality. FCFE shows equity walk-away but depends on accurate debt schedules on fleet notes.
The Blended View from Exit Matters Chapter 7 weights all three toward decision context:
Operating/reinvestment persona: Higher weight on FCFF and FCFE — cash generation and equity return govern whether to add a second crew or hold cash.
Preparing to sell: Higher weight on EV/EBITDA — strategic buyers and PE roll-ups anchor to market comps in landscaping.
Raising debt for fleet expansion: FCFF debt service coverage ratio dominates lender conversations.
Run all three simultaneously. When FCFF and EV/EBITDA converge within 15–20 percent, you have a defensible range. When they diverge by 40 percent or more, the gap usually reveals undervalued recurring contracts, unpriced fleet catch-up, or a multiple assumption that does not match comparables.
Seasonal and contract considerations buyers always adjust
1. Contract backlog and renewal documentation. Buyers price recurring revenue at a premium only when contracts are documented, assignable, and renewable without the owner's personal relationship. Export maintenance agreements with start dates, renewal terms, and cancellation clauses before diligence.
2. Crew bench and owner dependency. If the owner is the lead estimator, primary commercial salesperson, and backup crew chief, buyers apply key-man discount to both WACC and EV/EBITDA. Cross-training a field supervisor and documenting SOPs costs little but reads as premium-band evidence.
3. Geographic and customer concentration. A landscaping firm with 55 percent of revenue from one property-management company carries concentration risk that compresses the multiple by a full turn or more. Diversifying top-customer exposure below 25 percent can add six figures to blended enterprise value on a mid-size operator.
4. Off-season revenue lines. Snow removal, holiday lighting, and irrigation service reduce seasonality discount in FCFF projections. A firm with no winter revenue models a cash trough buyers price explicitly — either through lower multiple or seller note structure.
How XIT Matters handles landscaping valuation
XIT Matters runs the full Blended Valuation Engine — FCFF, FCFE, and EV/EBITDA simultaneously — on your normalized landscaping financials. The landscaping industry band (2.5× / 4.0× / 6.0×) loads with the specific premium and discount drivers listed above so band position is explicit.
Real-Time Slider Modeling lets you drag recurring revenue percentage, maintenance capex, DSO, and customer concentration and watch all three methods recalculate together. Landscaping owners model adding a commercial maintenance line or replacing two trucks before a potential sale — deferring $90K in fleet spend one year can swing blended value by more than the equipment cost.
The AI Scenario Analyst handles compound questions: "What if we shift from 52% project revenue to 68% recurring maintenance over three years?" That spans revenue mix, multiple band, WACC, and working capital simultaneously.
Six Persona Views cover operating, seller pre-market, and capital-raiser contexts on the same baseline. QuickBooks and Xero compatible import or manual entry. Free during beta.
Worked example — $4.2M commercial landscaping operator
Revenue $4.2M, gross normalized EBITDA $680K, maintenance capex $118K per year, net normalized EBITDA after maintenance capex $562K. Net debt (truck and equipment notes, less cash) $290K.
Recurring maintenance represents 71 percent of revenue across 140 commercial properties. Two field supervisors run daily operations; owner focuses on estimating and two anchor accounts representing 28 percent of revenue combined.
FCFF: $562K × (1 − 26% effective rate) = $416K unlevered net income. Less WC investment $38K. Plus depreciation add-back $118K. FCFF approximately $496K. Discounted at 15.5% WACC over five years with terminal value: intrinsic enterprise value $2.5M–$2.9M.
FCFE: FCFF less net interest after tax ($31K) and debt amortization ($72K). Annual FCFE approximately $393K. Subtract $290K net debt from equity value: walk-away range $1.9M–$2.3M.
EV/EBITDA: $562K × 4.0× median = $2.25M. At 5.2× (above median — strong recurring mix, commercial base, modern fleet): $2.92M. At 3.0× (below median — top two accounts at 28% combined): $1.69M. Seller-weighted blend anchors near $2.2M–$2.6M enterprise value.
Blended range, seller persona: $2.1M–$2.7M enterprise value. Equity walk-away after $290K net debt: $1.8M–$2.4M. Shifting two anchor accounts to documented three-year renewals before sale moves enterprise value toward the upper half of that range without adding a dollar of current-year EBITDA.
Bottom line
How to value a landscaping business in 2026 requires four steps beyond standard SMB math: normalize EBITDA down to true cash flow after maintenance capex, run FCFF and FCFE to expose both enterprise and equity walk-away values, apply the 2.5×–6.0× landscaping EV/EBITDA band with explicit premium and discount drivers, and blend all three toward your decision context. XIT Matters automates that methodology — landscaping band pre-loaded, recurring revenue and fleet sliders built in, WACC responsive to concentration — free during beta. Enter your financials in ten minutes, see where you sit on the band today, and model the operational moves that close the gap between discount and median before the buyer on the other side of your future transaction arrives with their own model already built.