How to Value an E-commerce Business the Right Way in 2026
If you are learning how to value an e-commerce business, the most important shift is to stop treating it like a simple revenue or profit multiple problem. The 2026 market rewards defensibility — repeat purchase rate, gross margin sustainability, channel diversification, inventory quality, and brand strength — far more than raw top-line growth. A single multiple pulled from a broker or aggregator term sheet often misses the real drivers that determine what your specific business is worth to a real buyer or to you as the owner holding it.
The reliable path uses the same three institutional methods professional appraisers and sophisticated acquirers rely on: Free Cash Flow to the Firm for the intrinsic value of the operations, Free Cash Flow to Equity for what actually belongs to you after obligations, and EV/EBITDA to anchor against what the market is currently paying for comparable e-commerce brands. Current 2026 SMB e-commerce multiples typically sit in the 2.0× to 5.5× EBITDA range, but the right multiple for your business depends on the specifics the simple rules of thumb ignore. Running all three methods and blending them produces a defensible range instead of a single guess.
Start by Normalizing Your Earnings — SDE vs. EBITDA for E-commerce Brands
Before any valuation method can be trusted, you have to normalize earnings. This is where many e-commerce owners get the first big answer wrong.
Seller's Discretionary Earnings (SDE) adds the owner's compensation, personal expenses, and one-time items back to the bottom line. It works reasonably well for very small brands under roughly $2 million in revenue where the owner is still the primary operator and a buyer will replace that role entirely. Once you scale past that threshold — and especially once you have professional management, systems, and a team — EBITDA becomes the institutional standard. Financial buyers and aggregators speak EBITDA because it reflects the cash flow a new owner can expect after paying market-rate management.
For most growing e-commerce businesses the owner-add-back is already minor, and forcing an SDE number can actually understate quality of earnings. The bigger normalization issues in e-commerce almost always sit in inventory and working capital. Aged or slow-moving stock that a buyer will carve out at a steep discount, unusual inventory builds ahead of a launch, or seasonality that distorts year-over-year comparisons all need to be adjusted before you run the three methods. The same is true for one-time platform fees, chargeback spikes, or promotional inventory that will not recur.
Exit Matters Chapter 9 walks through exactly how to normalize these items so the resulting EBITDA is both defensible in diligence and predictive of future cash flow. XIT Matters surfaces the key adjustments as live inputs so you can see how cleaning up inventory or owner compensation flows straight into every lens.
Run the Three Institutional Methods on Your Actual E-commerce Numbers
Once earnings are normalized, the three methods give you three different but complementary views of value.
Free Cash Flow to the Firm (FCFF) — what the book calls Lens 1 or Cash Flow to the Business — measures the cash the operations generate for all capital providers before financing decisions. For an e-commerce brand this starts with normalized EBITDA, subtracts taxes as if the business were unlevered, adds back non-cash charges, and subtracts the reinvestment required to sustain the business: replacement CapEx (usually modest for pure-play e-commerce) and the change in working capital. Inventory is the dominant working-capital line for most brands. Improving inventory turns or reducing aged stock releases cash that flows directly into higher FCFF and therefore higher enterprise value. The method then projects those cash flows forward five years with realistic growth and terminal value, discounts everything back at your weighted average cost of capital, and applies an illiquidity discount appropriate for a private business. The result is the intrinsic value of the machine itself, independent of how you chose to finance inventory or equipment.
Free Cash Flow to Equity (FCFE) — Lens 2 or Cash Flow to the Owner — answers the more personal question of what cash is actually available to you after debt service, taxes, and the reinvestment the business requires. Many e-commerce brands carry inventory financing, merchant cash advances, or revolving lines tied to stock. Those obligations reduce the equity cash flow even if the operations themselves are healthy. Lens 2 makes that visible. It is the number that tells you what you could take home or reinvest without starving the growth engine. Because working-capital swings are often larger in e-commerce than in service businesses, Lens 2 tends to be more volatile year to year, which is exactly why you want to see it alongside the other two methods.
EV/EBITDA — Lens 3 or What Buyers Will Pay — applies a market multiple to your normalized EBITDA. For 2026 SMB e-commerce the typical range is 2.0× to 5.5×, but your specific multiple is not a lookup table. It expands or compresses based on the factors buyers underwrite: channel concentration, repeat purchase rate, gross margin profile, brand strength, and working-capital quality. Amazon FBA dependency above 70 percent of revenue is treated as concentration risk and commonly compresses the multiple by roughly half a turn. Diversifying even 20 percent of revenue onto Shopify, your own DTC site, retail, or wholesale channels usually earns most of that compression back because a buyer can model continuity if Amazon changes terms or fees. High repeat customer revenue above 40 percent signals lower future acquisition cost and smoother cash flows, which buyers reward with both a higher multiple and a more stable FCFF projection. These adjustments are not theoretical; they show up in actual transaction data and in the diligence questions sophisticated acquirers ask.
The Blended View Turns Three Numbers Into Your Decision Compass
No single method tells the whole truth for an e-commerce owner. A pure FCFF number can look strong while heavy Amazon concentration makes the business fragile to platform changes. A high EV/EBITDA multiple can flatter a brand that still has too much working capital tied up in slow inventory. The Blended View — Lens 4 — combines the three methods with weights that shift depending on what you are actually trying to decide.
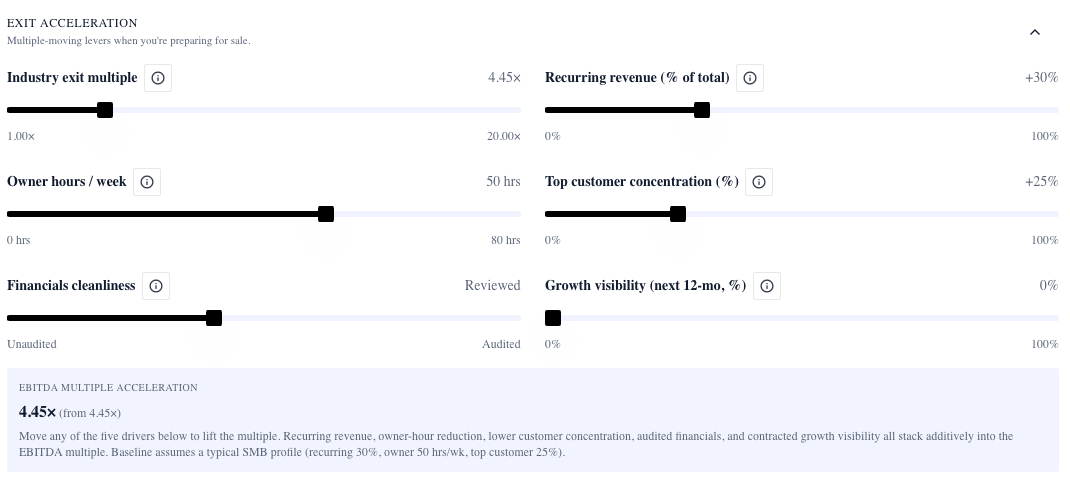
For day-to-day management the default weights lean toward the cash-flow lenses (roughly 40 percent FCFF, 40 percent FCFE, 20 percent EV/EBITDA) because you need to know whether the machine is getting stronger or weaker in real time. If you are preparing to sell in the next 12–24 months the weights flip toward the market lens (20/20/60) so you see the number a buyer is most likely to anchor on. Raising growth capital or planning family succession calls for still different blends that protect against dilution or emphasize equity value.
The same e-commerce business can show a Blended View of $1.8 million under day-to-day weights and $2.3 million under pre-sale weights on identical financials. That spread is not noise; it is information about which decisions matter most right now. XIT Matters recalculates the blend instantly when you change context or when fresh P&L and balance-sheet data flows in.
The E-commerce Levers That Actually Move Your Valuation
Once you can see the four lenses clearly, the highest-leverage moves become obvious. Channel diversification is usually the biggest. Moving from 85 percent Amazon FBA to a 65/35 split with your own Shopify or DTC channel does more than just reduce concentration risk — it often expands the EV/EBITDA multiple by 0.5× to 1.0×, exactly as the composite distribution brand in Exit Matters Chapter 18 experienced when it added a direct-to-consumer layer on top of its B2B revenue. The lift showed up in both higher normalized cash flows and a cleaner story for buyers.
Repeat customer revenue is the second powerful lever. Brands that cross 40 percent repeat see measurably stronger FCFF stability because customer-acquisition costs are amortized over more purchases and churn risk drops. That stability flows into a lower company-specific risk premium in the discount rate and a higher multiple. The operational work — better post-purchase email flows, loyalty programs, subscription options, or simply higher product quality that drives organic reorders — pays off in every lens at once.
Gross margin expansion and inventory efficiency are the quiet compounders. Every point of gross margin that survives after returns and promotions drops straight to EBITDA and therefore to all three methods. Improving inventory turns or clearing aged stock releases working capital that increases FCFF today and signals higher earnings quality to buyers tomorrow. Buyers routinely carve aged or non-core inventory out of a deal at a steep discount; cleaning it up before you run the numbers prevents an unpleasant surprise in diligence and lifts the cash purchase price.
These are not abstract strategies. They are the same levers Exit Matters Chapter 9 applies to any business — pricing, margins, working capital, reinvestment — translated into the specific context of e-commerce unit economics.
Why Generic Multiples and Broker Valuations Usually Miss the Mark for E-commerce
Most online advice for how to value an e-commerce business still defaults to a revenue multiple or a rule-of-thumb EBITDA multiple pulled from a public aggregator dashboard. Those shortcuts feel fast but collapse the moment your business has any of the real-world characteristics that move value: heavy Amazon concentration, lumpy inventory, seasonal working-capital swings, or a repeat-rate trajectory that is either improving or deteriorating. A single multiple cannot tell you whether fixing your channel mix or your inventory turns will add more value than the next product launch.
Broker Broker's Opinion of Value (BOV) letters often suffer the same limitation. They are usually built on a handful of recent comps and a single-method shortcut. They rarely run the full discounted-cash-flow math or let you stress-test the specific risks in your channel mix and working-capital profile. The result is a number that feels authoritative but does not survive the first real buyer conversation or the first operational decision you need to make with confidence.
The three-method institutional approach plus the context-weighted Blended View is the 2026 standard because it forces every assumption into the open — growth rate, margin sustainability, channel risk, working-capital needs — and shows you the range where the answers converge. That range is what you can actually act on or negotiate from.
Get Your E-commerce Valuation in Ten Minutes and Keep It Live
The practical barrier used to be that running FCFF, FCFE, and a properly adjusted EV/EBITDA required either a $50,000 appraisal or a week with a spreadsheet. XIT Matters removes that barrier for e-commerce owners. Connect your financials — whether through QuickBooks, Xero, or a direct export from Shopify or your accounting stack — and the engine produces the full three-method stack plus the default Blended View in roughly ten minutes. Manual entry takes a little longer but is still fast enough to be useful.
From that point the dashboard stays live. Change any input — normalized EBITDA, inventory levels, channel mix percentages, repeat-rate assumptions — and every lens and the blend recalculate instantly. Sliders let you model the exact impact of moving 15 percent of revenue off Amazon onto your own DTC site, or improving inventory turns by two turns per year, or lifting repeat purchase rate from 28 percent to 42 percent. The AI Scenario Analyst turns plain-English questions ("what if I clear the aged inventory and add a loyalty program?") into precise lever moves across revenue, margins, working capital, multiple expansion, and the final blended number.
This is what turns valuation from a once-a-year or pre-sale event into a weekly management habit. You see which operational improvements actually compound into exit value and which ones are just busywork. The same ten-minute connection that gives you today's number keeps giving you tomorrow's numbers as your business evolves.
The 2026 E-commerce Reality Check
Aggregator demand cooled sharply after the 2021–2022 peak, and 2026 multiples have rebuilt around proven brand strength rather than growth stories alone. If your e-commerce business already has repeat customer revenue above 40 percent, a genuinely branded product portfolio, and meaningful channel diversification, current multiples in the 2.0×–5.5× range are reasonable and achievable. If you are still heavily single-channel on Amazon, carrying significant aged inventory, or dependent on one-time customer acquisition, the next twelve months of operational work on channel mix, repeat-rate systems, and working-capital discipline is likely to create more value than accepting today's offer.
The framework in this page — and the live tool that automates it — gives you the map and the real-time GPS. You stop guessing what your e-commerce business is worth and start seeing exactly which moves move the number that matters.
Grounded in the four-lens framework, FCFF/FCFE math, working-capital normalization, and channel-diversification examples from Exit Matters Chapters 4, 9, and 18. All case examples are composites drawn from real owner engagements to protect confidentiality while illustrating the decision framework.