How to value a healthcare business — why payer mix and provider bench drive the band
Healthcare services trade at some of the highest SMB multiples — but the spread between 4.0× and 9.0× is wider than almost any other category. Provider concentration, payer mix, practice-management infrastructure, and compliance posture determine placement on the band more than headline EBITDA. Learning how to value a healthcare business means normalizing EBITDA to true free cash flow, running FCFF, FCFE, and EV/EBITDA together, and reading transaction comps against the premium and discount drivers PE platforms use when they evaluate dental, derm, ortho, and other roll-up categories in 2026.
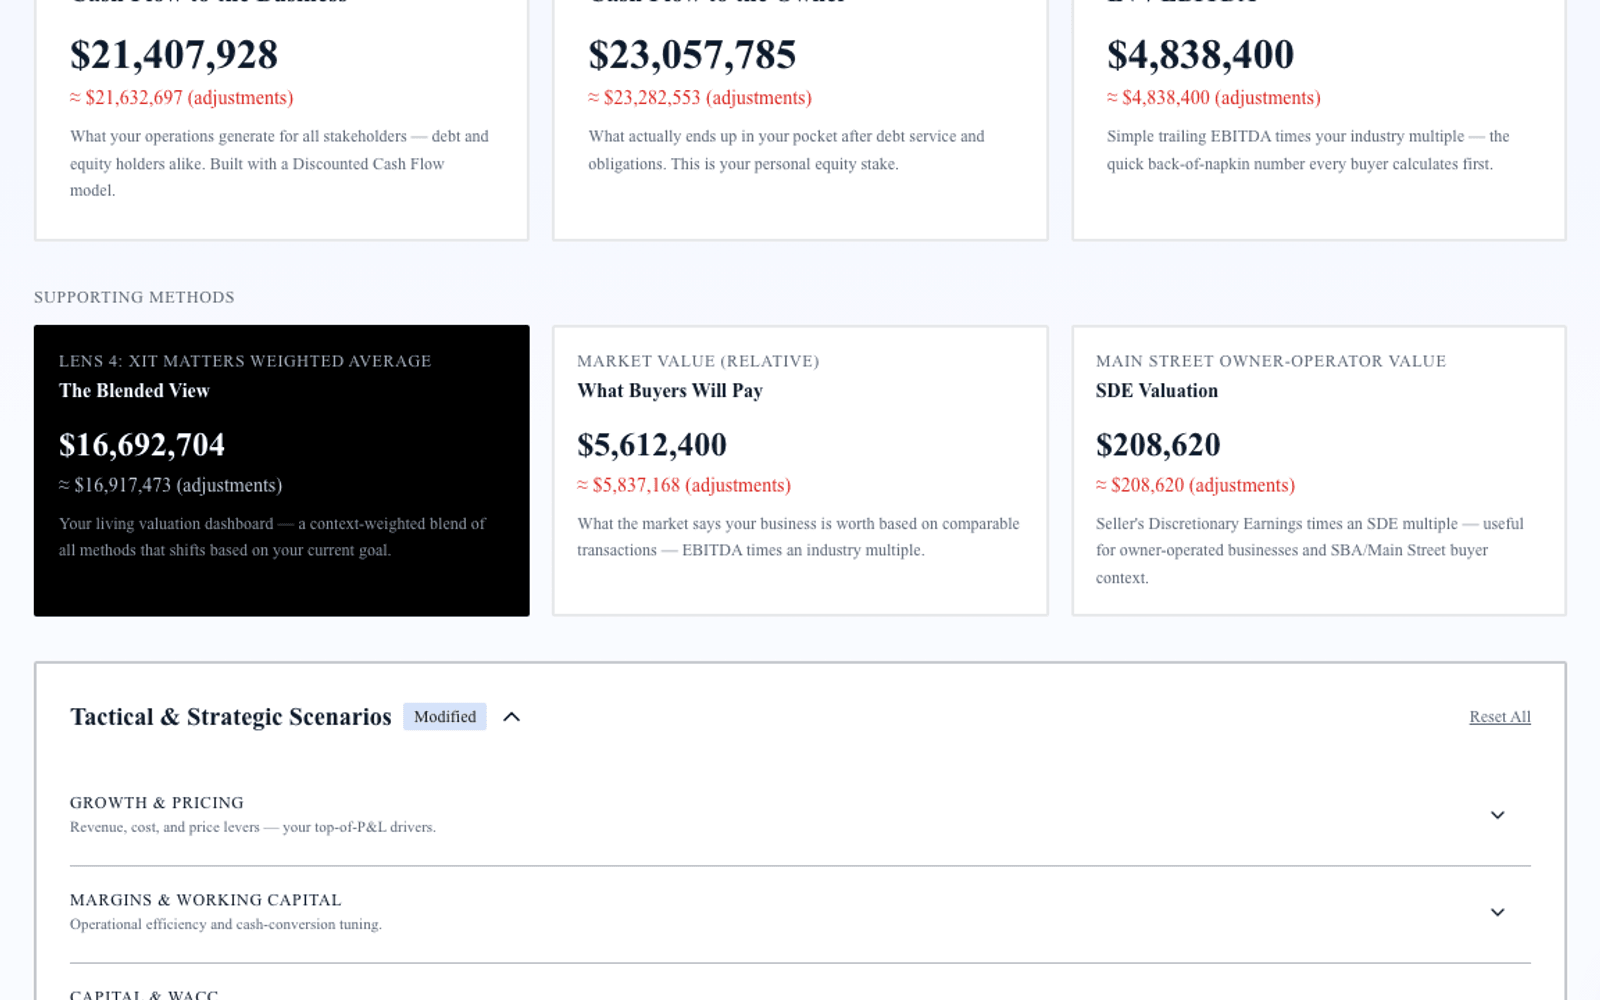
Exit Matters Chapter 7 describes the Blended View — three institutional methods weighted toward your decision. Healthcare adds four complications: provider revenue attribution, reimbursement and payer mix risk, clinical equipment capex, and regulatory compliance infrastructure. Handle those and institutional cash-flow logic applies.
The typical healthcare services business that transacts in the SMB market runs $1M–$30M in revenue and produces normalized EBITDA between $250K and $5M. Band position — not patient count alone — determines acquirer pricing.
Step 1 — Normalize EBITDA for a healthcare business
Add back:
Owner-provider compensation above market-rate employed-physician or clinical director equivalent — not total owner draw if the owner still carries a clinical panel. One-time equipment purchases expensed through the P&L. Non-recurring compliance remediation, legal settlements, or payer audit clawbacks that will not repeat. Depreciation and amortization on clinical and office equipment.
Subtract:
Maintenance capex on clinical equipment — imaging, lasers, surgical tools, diagnostic systems — required to maintain current patient capacity. Normalize related-party facility rent to arm's-length rates. Do not add back medical director fees required for ongoing accreditation.
Separate revenue by payer mix and provider in buyer materials. Solo-provider concentration and government reimbursement weight are priced explicitly in both FCFF and EV/EBITDA.
Step 2 — FCFF for healthcare operators
FCFF = Normalized EBITDA after Maintenance Capex × (1 − effective tax rate) + non-cash charges − net working capital investment − growth capex
Working capital in healthcare follows reimbursement cycles. Commercial payers at 28-day average collection behave differently in FCFF than Medicare at 45-day plus appeal lag. Accounts receivable quality — aging beyond 90 days, denial rates, coding accuracy — affects both working capital pegs at close and buyer confidence in trailing EBITDA.
Growth capex — additional provider build-out, new service line equipment, second location — is discretionary above maintenance. PE platforms model provider adds separately from base practice cash flow.
Discount rates for private healthcare practices typically run 11–18 percent. Multi-provider groups with commercial-heavy payer mix justify the lower end; solo providers with Medicaid concentration justify the upper end.
Step 3 — FCFE and equity walk-away
FCFE = FCFF − interest expense × (1 − tax rate) + net debt issuance
Healthcare practices carry equipment loans, practice acquisition debt, and sometimes seller notes from prior provider buy-ins. Enterprise value minus net debt equals equity walk-away. A practice with $5.8M enterprise value and $920K net debt delivers $4.88M equity — not $5.8M.
FCFE also informs partnership buy-in math: what does a new provider pay for equity given current cash generation after debt service?
Step 4 — EV/EBITDA market anchor for healthcare
| Position | Multiple |
|---|---|
| Low (discount) | 4.0× |
| Median | 6.0× |
| High (premium) | 9.0× |
Premium drivers: Practice-management infrastructure with scalable billing and scheduling. Multi-provider revenue mix with balanced productivity. PE roll-up category exposure in dental, dermatology, orthopedics, and related specialties. Clean compliance history and documented clinical protocols.
Discount drivers: Solo-provider revenue concentration above 75 percent. Heavy Medicare or Medicaid reimbursement without rate hedge. Compliance gaps, open payer audits, or unresolved licensing issues.
At 6.0× median on $1.1M normalized EBITDA, enterprise value lands at $6.6M. At 8.5× for a three-provider dermatology group with 71 percent commercial mix and documented PM infrastructure, enterprise value reaches $9.35M.
Step 5 — Blended View for healthcare owners
Weight FCFF when evaluating adding a provider or service line — does incremental clinical capacity generate positive NPV after equipment and compensation? Weight EV/EBITDA when negotiating with a PE platform or strategic acquirer. Weight FCFE for partnership buyout and personal walk-away after equipment debt.
Run all three. Divergence often reveals AR quality issues, unnormalized owner-provider draw, or multiple assumptions misaligned with specialty comparables.
Provider bench, payer mix, and compliance — three diligence pillars
1. Provider contracts and productivity. Export twelve-month work RVU or production by provider with employment or contractor agreements attached. Buyers model forward revenue from provider capacity, not trailing averages alone.
2. Payer mix and collection quality. Aging AR by payer, denial rates, and recent coding audit results. A clean 90-day AR schedule supports premium placement; 22 percent of AR beyond 120 days triggers EBITDA adjustment.
3. Compliance and licensing. State licensing, DEA where applicable, HIPAA documentation, and any open payer or regulatory inquiries. Unresolved compliance issues become indemnity carve-outs or price reductions at LOI.
4. Equipment and lease on clinical assets. Imaging and surgical equipment with remaining useful life and maintenance logs. Above-market facility lease or short remaining term compresses EV/EBITDA on single-location practices.
How XIT Matters handles healthcare valuation
XIT Matters runs FCFF, FCFE, and EV/EBITDA with the healthcare band (4.0× / 6.0× / 9.0×) pre-loaded. Sliders adjust growth visibility, financials cleanliness, DSO, and customer concentration with instant recalculation across all three methods. The AI Scenario Analyst models "What if we add a second provider and shift payer mix from 48% to 62% commercial?" Six Persona Views cover operator, seller, and investor contexts. QuickBooks and Xero compatible. Free during beta.
Worked example — $5.4M multi-provider dental group
Revenue $5.4M, gross normalized EBITDA $1.05M, maintenance capex $88K, net normalized EBITDA $962K. Net debt $340K. Three providers with balanced production; commercial payer mix 64 percent; practice-management system with documented SOPs.
FCFF: Discounted at 12.8% WACC: enterprise value $6.8M–$7.6M.
FCFE: Equity walk-away after $340K net debt: $6.5M–$7.3M.
EV/EBITDA: $962K × 6.0× = $5.77M median; 7.8× premium scenario = $7.50M.
Blended seller range: $6.2M–$7.2M enterprise. Resolving two open insurance denials and documenting associate provider contracts before market moves the blend toward the upper half without adding current-year EBITDA.
PE roll-up dynamics in healthcare services
Private equity platforms in dental, dermatology, orthopedics, and related specialties acquire platforms at median-to-premium multiples and add providers post-close. They underwrite to pro forma EBITDA after synergies — centralized billing, group purchasing, and added provider capacity — not trailing standalone EBITDA alone. Understanding platform buyer math helps you position a practice that might trade at 6.5× standalone but 7.5×–8.5× to a strategic platform with documented add-provider economics.
Solo practitioners approaching PE conversations should model two scenarios in the Blended View: standalone sale to another provider at discount-to-median multiples, and platform sale with employment or partnership rollover at premium multiples with earn-out on growth. FCFE on the platform path includes rollover equity value that standalone FCFE excludes — the total economic outcome may favor lower cash at close with retained equity participation.
Present provider production reports, payer mix by month, AR aging by payer, equipment lists with liens, and compliance documentation before the first buyer meeting. Clean financials with normalized owner-provider compensation and arm's-length facility rent tighten the spread between seller-prepared range and QoE-validated range — the gap that kills deals is usually normalization surprises, not multiple disagreement.
Specialty-specific band placement — dental, derm, and ortho vs. primary care
Not every healthcare practice belongs at the same point on the 4.0×–9.0× band. Dental, dermatology, and orthopedics platforms have paid premium multiples for a decade because procedures are standardized, provider add-on economics are proven, and PE roll-up playbooks are mature. Primary care and mixed specialty groups without procedure volume trade closer to median unless they carry strong commercial payer mix and multi-provider infrastructure.
A solo family medicine practice with 62 percent Medicare reimbursement may anchor at 4.0×–4.5× even with strong clinical reputation — reimbursement risk dominates. A three-provider dental group with 67 percent commercial mix, same-store production growth, and documented hygiene program supports 6.5×–7.5× because acquirers can underwrite add-provider economics post-close. When you model how to value a healthcare business, anchor comparables to your specialty sub-category, not healthcare services broadly.
Procedure mix also affects normalized EBITDA. High-margin elective procedures support premium placement when coding and compliance are clean; heavy E/M visit volume with thin margin compresses EV/EBITDA even at identical top-line revenue. Separate clinical revenue by CPT category in buyer materials so acquirers see margin architecture, not a blended revenue line.
Accounts receivable quality deserves its own normalization pass before valuation. Healthcare practices with 18 percent of AR beyond 120 days receive working capital peg adjustments at close that reduce equity walk-away even when trailing EBITDA looks strong. Run AR aging by payer monthly for twelve months before market; clean up stale claims and document denial appeal outcomes. A practice that reduces 120-plus-day AR from 16 percent to 7 percent over six months may not show EBITDA growth but improves FCFE at close because net working capital peg tightens in the buyer's favor — which you can negotiate back into price if you document the improvement before LOI.
Staff compensation mix between clinical and administrative roles also affects normalized EBITDA. Practices understaffing billing and coding to inflate clinical provider margin receive QoE adjustments when denial rates spike. Right-size administrative bench before sale — clean collections infrastructure is premium-band evidence on the healthcare multiple band. Document billing FTE per provider and denial rate trend for twelve months before diligence. Practices that invest in revenue cycle management before sale often recover the cost in higher blended enterprise value at close — buyers pay for clean collections, not just clean clinical outcomes. If you carry equipment debt on imaging or surgical assets, produce a lien schedule with remaining payments — net debt surprises at wire are as common in healthcare transactions as EBITDA restatements. Run the Blended View under both standalone and platform-sale personas before you choose which buyer pool to prioritize — the optimal path is not always the highest headline multiple offered first.
When to escalate to formal healthcare appraisal
Engage healthcare-specialist CPA, Quality of Earnings, or formal appraisal for signed LOI diligence, PE platform term sheets with rollover equity, hospital joint venture requirements, Stark Law review contexts, and estate or divorce proceedings where a binding number is required.
Bottom line
How to value a healthcare business in 2026 requires normalizing EBITDA after clinical equipment capex, modeling payer and provider mix explicitly, running FCFF and FCFE for enterprise and equity views, applying the 4.0×–9.0× band with specialty-specific drivers, and blending all three toward your decision. XIT Matters automates that framework — healthcare band loaded, collection and concentration sliders built in — free during beta. Ten minutes to your first answer, then model the provider and payer moves that shift you from discount to median before the PE platform arrives with their own roll-up model already built.