How to Value a Restaurant Business — The Framework Buyers Already Use
Most restaurant owners who want to know how to value a restaurant business get a single answer: a revenue multiple or an EBITDA multiple from a broker. That shortcut collapses the moment your deal hits diligence. Buyers do not buy multiples — they buy predictable cash flow with defensible risk attached. The framework that survives diligence runs three institutional methods, blends them into a decision range, and exposes the restaurant-specific drivers that move your position inside that range. This guide walks you through that process step by step, from financial normalization through the blended answer, without needing an appraiser to complete the first pass.
Step 1: Gather and Clean Two Years of Financial Data
Before any valuation method produces a defensible number, the underlying financials have to be clean. Pull two full years of P&L and trailing-twelve-month data plus the current balance sheet and most recent cash flow statement. You need the trend, not just the snapshot — buyers will ask for both years plus the trailing-twelve in every letter of intent.
Check food cost and labor cost as percentages of revenue against restaurant industry benchmarks. If food cost runs above 35 percent or labor above 33 percent without a clear concept-specific reason (premium ingredients, intentionally elevated service), flag those lines for normalization discussion. Outliers signal either genuine competitive differentiation or hidden margin pressure that buyers will identify in diligence.
Look for non-recurring items: equipment failures that were expensed rather than capitalized, one-time marketing spends for a grand reopening, insurance claims, and pandemic-era government grants or employee retention credits that will not repeat. These need to come out of your baseline before you normalize owner compensation or calculate EBITDA.
Step 2: Normalize EBITDA — The Right Earnings Base for Your Concept
Normalized EBITDA is the number every downstream method is built on. Getting it wrong at this step propagates error through all three lenses.
Start with reported EBITDA. Add back owner compensation above the market rate for a qualified general manager in your market — if you pay yourself $200K in a market where a GM costs $80K, the $120K difference is an add-back. Add back personal expenses run through the business: vehicle, personal travel, family members on payroll who will not be retained. Add back one-time repairs and non-recurring items identified in Step 1.
Then subtract a market-rate management expense. This is the step most owners skip and most buyers catch. If you are removed from the business at close, a new owner needs to pay someone to do what you did. That market-rate cost belongs in normalized EBITDA so the buyer can underwrite real cash flow, not fantasy EBITDA.
For SDE versus EBITDA: use SDE only if your revenue sits below roughly $1M and you expect a buyer to operate the restaurant themselves. Above that threshold — and especially once you have a manager bench or multiple units — EBITDA is the institutional standard. Defaulting to SDE at scale overstates earnings in a way diligence will reverse.
Step 3: Run Free Cash Flow to the Firm (FCFF) — the Operations Value
FCFF measures what the restaurant operations generate for all capital providers — debt and equity combined — before financing decisions enter the picture. It is the intrinsic value of the machine.
Start with normalized EBITDA. Subtract taxes calculated on an unlevered basis (as if the business carries no debt) to isolate operating cash generation. Add back depreciation and amortization, since those are non-cash charges. Subtract maintenance capital expenditures — the ongoing spend required to keep the kitchen, equipment, and space operational without growing. For most restaurants this runs 1.5 to 3 percent of revenue annually; if you have been deferring maintenance, this number should reflect what a new owner would actually spend.
Adjust for working-capital changes. Restaurants generally run with lean working capital compared to inventory-heavy businesses, but seasonal peaks — holiday inventory builds, summer patio staffing — can produce temporary cash consumption that distorts a single quarter. Normalize across trailing-twelve.
Project FCFF forward for five years using reasonable assumptions: revenue growth in line with your market, margin stability, and maintenance capex. Apply a terminal value at Year 5 using a conservative growth rate. Discount everything back at your weighted average cost of capital — typically 12 to 18 percent for an SMB restaurant depending on size and risk profile — and apply an illiquidity discount of 10 to 30 percent to reflect that restaurant equity is not a liquid asset. The result is the enterprise value of the operations on a stand-alone basis.
Step 4: Run Free Cash Flow to Equity (FCFE) — Your Walk-Away Math
FCFE answers a different and more personal question: after debt service, after reinvestment, how much cash actually belongs to you as the equity holder? This is the number that tells you what you would walk away with if a buyer assumed all your existing obligations.
Begin with FCFF. Subtract after-tax interest on all restaurant debt: equipment loans, merchant cash advances, SBA loans, and any lease guarantees that function as financing obligations. Add the net effect of new borrowing minus debt repayment. Subtract any equity reinvestment required to sustain current operations that was not already captured in the capex line.
For restaurant owners, FCFE often diverges sharply from FCFF when equipment financing is heavy or when an SBA loan is attached to the real estate. A restaurant showing $420K EBITDA with $95K in annual equipment debt service and $45K in SBA payments has a very different equity cash flow than one that owns its equipment outright. FCFE forces that distinction into the open before a broker conversation, so you go in with clear expectations rather than discovering the walk-away number late in diligence.
Step 5: Apply the Restaurant EV/EBITDA Band — 1.8× to 4.0× on Normalized EBITDA
EV/EBITDA anchors your valuation to what acquirers are actually paying for comparable restaurant businesses in 2026. The SMB restaurant band for deals in the $500K–$10M revenue range runs:
Low end (1.8×–2.5×). Single-unit independents where the owner runs the kitchen or floor, above-market rent or a lease expiring within three years, a concept dependent on a single chef or personality, and limited delivery or catering revenue outside dine-in. Buyers apply key-person and lease discounts that push the multiple toward the floor of the band.
Median (2.8×). A proven manager bench with documented SOPs, stable food and labor cost percentages near industry benchmarks, a mix of dine-in plus delivery or catering revenue at 10 to 20 percent of the top line, clean two-year financials with normalized EBITDA, and a lease with adequate remaining term at market or below-market rates. This is the range a well-run independent with professional management should target.
High end (3.5×–4.0×). Multi-unit operators with documented systems and replication proof, owned or below-market leased real estate, strong delivery and catering channels providing revenue diversification, franchise systems or scalable fast-casual concepts, and a manager bench that does not include the owner in any operational role.
Premium drivers — multi-unit scale, below-market lease, delivery and catering contribution — move you toward the high end. Discount drivers — owner still running the kitchen, above-market rent, single-chef dependency — anchor you at the low end regardless of what EBITDA says on paper. Multiple the relevant multiple against your normalized EBITDA to produce EV/EBITDA enterprise value.
Step 6: Build the Blended View — One Decision Range from Three Methods
No single method tells the full story for a restaurant owner. FCFF can look strong while a short-lease risk compresses what a buyer will actually pay. A high EV/EBITDA number can mask walk-away cash that is much lower after equipment debt. The Blended View combines all three methods with context-weighted importance to produce the range where the answers converge — the number you can act on and negotiate from.
For day-to-day management: weight FCFF and FCFE more heavily (roughly 40/40/20 across the three methods) because you need to know whether operations are building or eroding cash-flow quality in real time. For pre-sale preparation: shift weight toward EV/EBITDA (roughly 20/20/60) so you see the number a buyer will anchor on in an LOI. For SBA loan conversations: FCFE is the primary lens because lenders underwrite debt service capacity, not enterprise value.
The same restaurant can show a meaningfully different blended headline under owner-operator weighting versus seller weighting on identical financials. That gap is information. It tells you which levers — owner delegation, lease renegotiation, catering channel growth — move the seller-weighted number most, so you invest operational energy in the right places before going to market.
Step 7: Apply Premium and Discount Adjustments
With the blended range in hand, pressure-test it against the specific factors buyers will examine in diligence.
Premium drivers for restaurant valuations. Multi-unit operator status with stable unit economics at each location. Below-market lease with eight or more years of remaining term. Delivery and catering revenue comprising 15 to 25 percent or more of total revenue, diversifying beyond volatile dine-in traffic. Documented manager bench and operational SOPs that survive a thirty-day owner absence. Real estate ownership that can be separated from operating value in a sale-leaseback structure.
Discount drivers for restaurant valuations. Owner-dependent operations where the owner runs the kitchen, manages the floor, or is the primary relationship with key staff. Above-market rent consuming more than 8 to 10 percent of revenue, or a lease within three years of expiration. Single-chef dependency where menu execution relies on one individual's skill. Heavily dine-in revenue concentration with minimal delivery or catering diversification. Deferred maintenance on equipment or leasehold improvements that a buyer will price into the deal.
Quantify each driver in dollars. A key-person discount that moves the multiple from 2.8× to 2.2× on $400K normalized EBITDA is $240K in lost enterprise value. Running that math before engaging a broker tells you exactly what hiring and delegating a kitchen manager is worth — and gives you a concrete ROI to compare against the cost.
A Worked Example — Owner-Operated Fast-Casual, $1.9M Revenue
Consider a single-unit fast-casual concept, $1.9M revenue, $310K normalized EBITDA after adding back excess owner compensation and removing a one-time refrigeration repair. The owner works the line four shifts per week and the lease has three years remaining at slightly above-market rates. Catering accounts for 9 percent of revenue.
FCFF at a 14 percent WACC with a 20 percent illiquidity discount produces an enterprise value range of $820K to $950K, sensitive to whether Year 3 growth assumptions hold. FCFE after $55K annual equipment debt service lands $740K to $880K — the personal walk-away number. EV/EBITDA at 2.2× to 2.5× (discounted from median for owner dependency and short lease) implies $682K to $775K.
Blended under seller weighting the range converges around $760K to $870K.
The owner can now see the precise gap between current market value and what is theoretically possible at 2.8× median: roughly $350K to $450K of incremental enterprise value waiting in the bank if owner dependency and lease risk are resolved before sale. That is the operational roadmap — hire a kitchen manager, negotiate a lease extension, grow catering to 18 percent of revenue — each step measurable in dollars before spending on a broker retainer.
When Self-Valuation Is Enough — and When It Is Not
Run the three-method stack yourself for sale preparation, SBA loan anchor conversations, partnership buyouts, and operational priority-setting. These are the use cases where a defensible internal range is exactly what you need and a formal appraisal is overkill.
Commission a formal appraisal or Quality of Earnings engagement when the event is legally binding: litigation, divorce proceedings, IRS estate or gift-tax filings, or post-LOI diligence where a lender requires third-party certification. The structured methodology in this guide — and in XIT Matters — prepares you for those engagements. Walk into a QoE with normalized financials and your own three-method range already in hand and the professional process moves faster and cheaper.
Using XIT Matters to Run the Full Stack in Ten Minutes
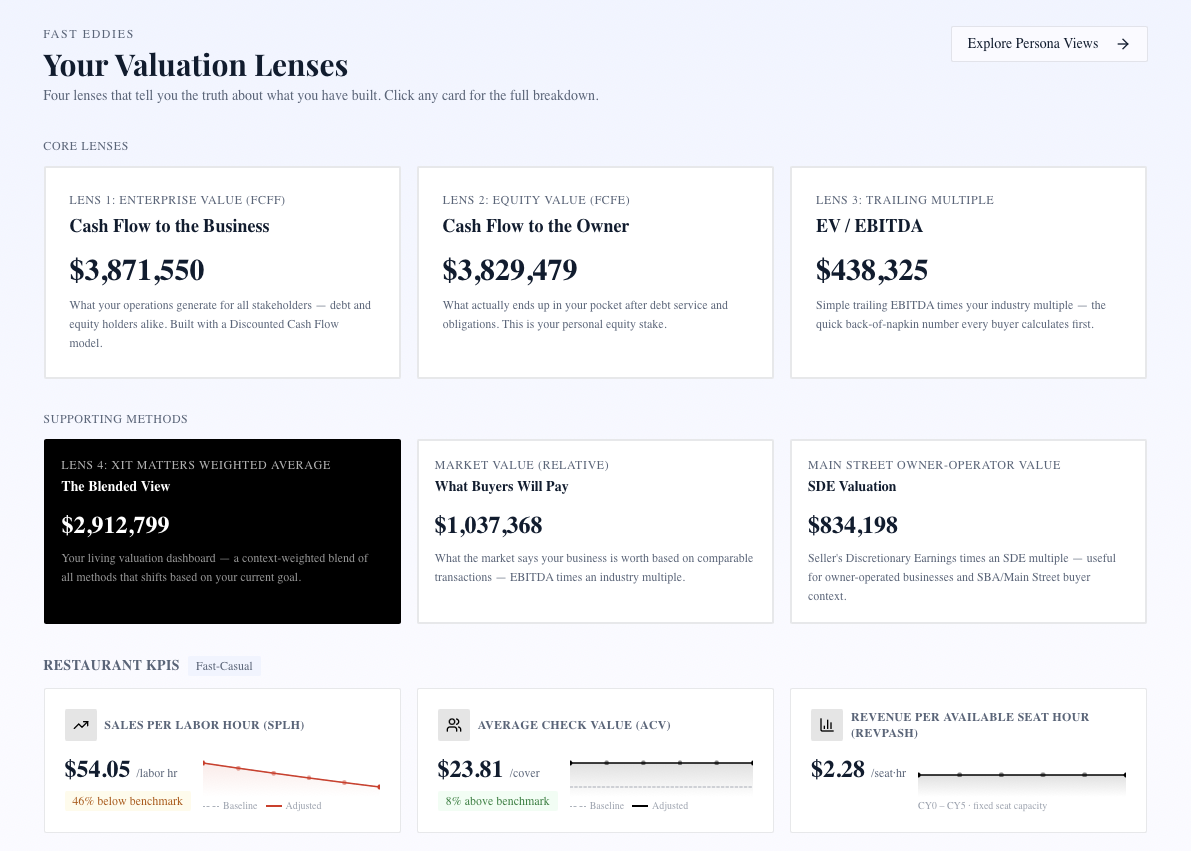
XIT Matters runs FCFF, FCFE, and EV/EBITDA simultaneously on the restaurant industry band — 1.8× low, 2.8× median, 4.0× high — and produces the Blended View with context-appropriate weights. Enter financials manually or connect QuickBooks or Xero-compatible data. The restaurant-specific sliders expose lease burden, owner dependency, catering mix, and labor cost as live inputs — every adjustment recalculates all three lenses and the blended headline.
The AI Scenario Analyst accepts plain-English questions: "What if I hired a $70K kitchen manager and reduced my line shifts to one per week?" It maps the answer across normalized EBITDA, owner-dependency discount, multiple band position, and the final blended number — without a spreadsheet build. Free during beta, no credit card, about ten minutes to first range.
The Bottom Line for Restaurant Owners
To value a restaurant business correctly, stop at the multiple and you will arrive with the wrong answer. Normalize your financials with precision. Run FCFF for intrinsic operations value, FCFE for personal walk-away math, and EV/EBITDA against the 1.8×–4.0× restaurant band. Blend the three with context-appropriate weights. Quantify every premium and discount driver in dollars so you know exactly what the operational fixes are worth before you pay a broker to find a buyer. That is the process buyers already run on your business — you should run it first.