How to value a retail business — why inventory and channel mix beat a revenue multiple
Retail transactions compress and expand on factors a simple revenue multiple never captures. Inventory quality, lease terms, e-commerce mix, and multi-store unit economics determine whether a buyer prices you at 1.8× or 4.0×. Learning how to value a retail business means normalizing EBITDA to true free cash flow, running FCFF, FCFE, and EV/EBITDA together, and reading the 1.8×–4.0× band against premium and discount drivers that govern specialty and multi-store retail deals in 2026.
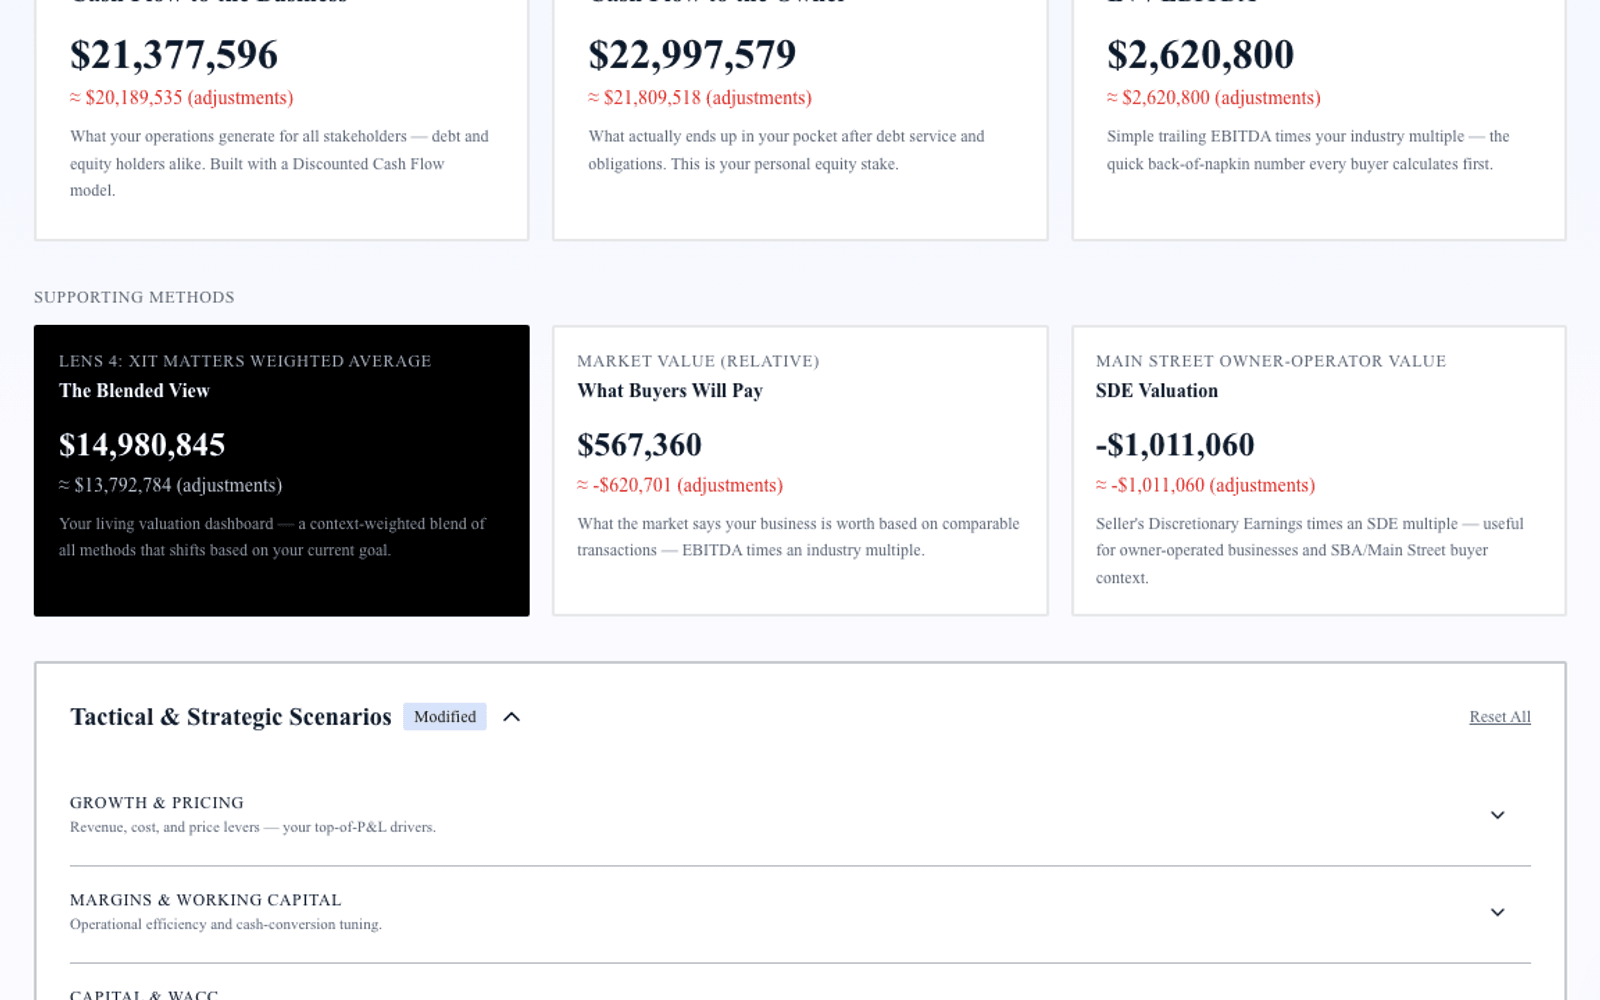
Exit Matters Chapter 7 frames the Blended View — three institutional methods weighted toward your decision. Retail adds four complications: inventory and working capital intensity, lease economics, omni-channel revenue mix, and single-store versus multi-store scalability. Handle those and institutional cash-flow logic applies.
The typical retail business that transacts in the SMB market runs $500K–$10M in revenue and produces normalized EBITDA between $80K and $1.5M. Band position — not square footage alone — determines acquirer pricing.
Step 1 — Normalize EBITDA for a retail business
Add back:
Owner compensation above or below market-rate store or district manager pay. One-time inventory write-downs from discontinued product lines. Non-recurring remodeling, relocation, or marketing spend. Depreciation and amortization on fixtures and equipment.
Subtract:
Maintenance capex on fixtures, POS systems, and store equipment required to maintain current selling capacity. Adjust related-party rent to arm's-length rates. Write down obsolete inventory before presenting to buyers — aged stock gets adjusted in diligence regardless.
Separate in-store, e-commerce, and marketplace revenue in buyer materials. Channel mix drives both multiple placement and working capital assumptions in FCFF.
Step 2 — FCFF for retail operators
FCFF = Normalized EBITDA after Maintenance Capex × (1 − effective tax rate) + non-cash charges − net working capital investment − growth capex
Working capital in retail is central. Inventory turns, days inventory outstanding, vendor payment terms, and seasonal build cycles tie cash differently than service businesses. A specialty retailer running eight inventory turns with 42-day DIO generates different FCFF than one at five turns with 68-day DIO on the same EBITDA.
Growth capex — second location build-out, expanded warehouse, e-commerce platform — is discretionary above maintenance. Model new-store ROI separately for expansion decisions.
Discount rates for private retail operators typically run 14–22 percent. Multi-store operators with omni-channel revenue justify the lower end; single-location lease-exposed shops justify the upper end.
Step 3 — FCFE and equity walk-away
FCFE = FCFF − interest expense × (1 − tax rate) + net debt issuance
Retail businesses carry inventory lines of credit, equipment loans, and sometimes merchant cash advances. Enterprise value minus net debt equals equity walk-away. Net working capital pegs at close adjust equity further when inventory or AR differs from LOI assumptions.
Factor lease economics: above-market rent compresses EV/EBITDA; below-market assignable lease with long remaining term supports premium placement.
Step 4 — EV/EBITDA market anchor for retail
| Position | Multiple |
|---|---|
| Low (discount) | 1.8× |
| Median | 2.8× |
| High (premium) | 4.0× |
Premium drivers: Strong online channel beyond foot traffic with repeat purchase data. Branded private-label mix with defensible margin. Proven multi-store unit economics with same build-out cost and mature margin profile.
Discount drivers: Single-store dependency. Lease above market or short remaining term. No e-commerce footprint in a category where digital is structural, not optional.
At 2.8× median on $620K normalized EBITDA, enterprise value lands at $1.74M. At 3.8× for a three-store specialty operator with 36 percent e-commerce and private-label margin, enterprise value reaches $2.36M.
Step 5 — Blended View for retail owners
Weight FCFF when evaluating second-location expansion — does unit one cash flow fund unit two build-out? Weight EV/EBITDA when selling to a multi-store acquirer or franchise platform. Weight FCFE for lease renewal versus sale decisions and personal walk-away after inventory debt.
Run all three. Divergence often reveals inventory overstatement, lease mispricing, or e-commerce revenue not normalized for returns and shipping cost.
Inventory, lease, and omni-channel — what buyers adjust first
1. Inventory aging and shrink. Export inventory report by category with last-sale dates. Write down stock with no sale in eighteen months before diligence — buyers will at a harsher discount.
2. Lease assignability and economics. Remaining term, renewal options, percentage rent, and assignability on sale. Eight years remaining at 12 percent below market supports premium; eighteen months at 8 percent above market compresses EV/EBITDA.
3. E-commerce unit economics. Separate gross margin after shipping, returns, and marketplace fees from in-store margin. Online revenue at 22 percent blended margin does not carry the same value as in-store at 48 percent unless repeat rate and CAC are documented.
4. Multi-store proof. Unit-level P&L with same capex, ramp, and mature EBITDA across stores is premium evidence. One flagship with two underperforming satellites gets discounted in both FCFF and EV/EBITDA.
How XIT Matters handles retail valuation
XIT Matters runs FCFF, FCFE, and EV/EBITDA with the retail band (1.8× / 2.8× / 4.0×) pre-loaded. Sliders adjust days inventory outstanding, growth visibility, industry multiple, and customer concentration with instant recalculation. The AI Scenario Analyst models "What if we grow e-commerce from 22% to 35% of revenue while holding inventory turns at nine?" Six Persona Views cover operator, seller, and investor contexts. QuickBooks and Xero compatible. Free during beta.
Worked example — $3.6M specialty home goods retailer
Revenue $3.6M across two stores plus e-commerce, gross normalized EBITDA $580K, maintenance capex $52K, net normalized EBITDA $528K. Net debt $210K. E-commerce 31 percent of revenue; private-label 24 percent of mix; assignable below-market lease with six years remaining on flagship location.
FCFF: Discounted at 16.8% WACC: enterprise value $1.55M–$1.85M.
FCFE: Equity walk-away after $210K net debt: $1.34M–$1.64M.
EV/EBITDA: $528K × 2.8× = $1.48M median; 3.5× omni-channel scenario = $1.85M.
Blended seller range: $1.45M–$1.80M enterprise. Cleaning inventory aging and documenting e-commerce repeat rate before market moves the blend toward 3.2×–3.5× territory.
Seasonality and promotional calendar normalization
Retail EBITDA swings with holiday inventory build, back-to-school resets, and promotional markdown cycles. Trailing-twelve-month EBITDA that includes an unusually strong Q4 or an inventory write-down from a failed line misrepresents steady-state cash generation. Normalize promotional spend and inventory markdowns to a three-year average before applying EV/EBITDA multiples.
Present same-store sales growth separately from new-store contribution if you opened a second location within the trailing period. Buyers apply mature-store multiples to comp base and discounted multiples or explicit ramp schedules to new units — the same logic fitness multi-unit operators use. FCFF projections built on normalized same-store margin avoid the overstatement that collapses LOI price when QoE reconciles promotional timing.
Present three-year P&L with channel split, inventory aging report, lease abstract with assignability opinion, and same-store sales comp if multi-unit. Clean inventory and documented e-commerce unit economics reduce net working capital peg fights at LOI. Buyers price retail on steady-state margin — give them steady-state numbers, not peak-season trailing EBITDA inflated by one-time promotional calendar.
Franchise versus independent retail — how brand economics change the band
Franchise retail locations trade with royalty drag on EBITDA — typically 4–8 percent of revenue plus marketing fund contributions — but may support premium placement when the brand carries national recognition, proven unit economics, and assignable franchise agreements. Independent specialty retailers keep full margin but carry brand-building risk that compresses multiple when the owner is the merchandising and buying department.
Buyers apply EV/EBITDA to post-royalty EBITDA for franchise units, not pre-royalty store margin. A franchisee reporting $540K store-level EBITDA with 6 percent royalty has $507K normalized EBITDA for multiple application — a meaningful difference at 2.8× median ($1.42M vs. $1.51M enterprise value). Transfer fees, franchisor approval timelines, and required remodel cycles affect close structure and FCFE timing.
When modeling how to value a retail business, disclose franchise status, remaining term, and transfer conditions in the first buyer conversation. Multi-store franchise operators underwrite to franchisor unit economics; independent omni-channel specialists underwrite to channel mix and inventory turns.
Gross margin architecture by channel — why buyers unbundle your P&L
In-store retail often runs 45–55 percent gross margin; e-commerce on the same SKU mix may run 32–40 percent after shipping, returns, and marketplace fees. Lumping channels into one blended margin misprices FCFF and EV/EBITDA simultaneously. Present gross margin by channel with return rates and average order value so acquirers model forward cash flow from channel-specific unit economics.
Private-label mix changes the story further. A specialty retailer with 28 percent private-label penetration at 62 percent gross margin supports premium placement because defensible margin survives promotional cycles better than pure resale of third-party brands. Document private-label as a percentage of revenue and margin contribution in buyer materials — it is one of the premium drivers on the retail band alongside omni-channel reach.
Shrink and inventory accuracy also move working capital pegs. Retailers running annual physical counts with shrink below 1.5 percent of sales support cleaner net working capital negotiations; operators at 3 percent or higher receive inventory true-up adjustments that claw back equity at close. Invest in cycle counting and RFID or POS integration before sale — operational hygiene reads as premium-band evidence even when it does not change trailing EBITDA.
Foot traffic conversion rate — transactions divided by door counts — helps buyers separate location quality from merchandising execution. A store converting 28 percent of foot traffic with rising average ticket supports premium placement; one converting 14 percent with declining ticket signals lease or concept risk that compresses EV/EBITDA even when rent is below market. Pair conversion data with e-commerce repeat purchase rate when presenting omni-channel operators — together they show durable demand, not one-time promotional spikes. Retailers who can demonstrate repeat online purchase within ninety days of first order support higher EV/EBITDA placement because customer acquisition cost amortizes across multiple transactions. Same-store sales growth for twelve consecutive months — excluding new units — is the comp metric strategic buyers request first; lead with it in executive summary materials. Model inventory turns and DIO together in FCFF — improving from six turns to eight on the same revenue base releases cash that increases equity walk-away without changing EBITDA. That working-capital release is often worth more than a promotional quarter.
When to escalate to formal retail appraisal
Engage formal appraisal or CPA-led Quality of Earnings for signed LOI diligence, SBA-backed acquisitions, landlord lease assignment requirements, franchise transfer approvals, and partnership or estate contexts requiring a binding number.
Bottom line
How to value a retail business in 2026 requires normalizing EBITDA after fixture maintenance capex, cleaning inventory and lease economics, running FCFF and FCFE for enterprise and equity views, applying the 1.8×–4.0× band with explicit omni-channel and multi-store drivers, and blending all three toward your decision. XIT Matters automates that framework — retail band loaded, inventory and channel sliders built in — free during beta. Ten minutes to your first answer, then model the channel and inventory moves that shift you from discount to median before the multi-store acquirer arrives with their own unit-economics model.