Valuation calculator for agency owners — why revenue multiples fail your retainer model
If you need a valuation calculator for agency owners, a generic professional-services multiple will misprice your shop before you enter last year's billings. Digital agencies trade on normalized EBITDA within a rational band — low 2.5×, median 4.0×, high 6.5× for typical Main-Street to lower-middle-market deals in the $1M–$15M revenue range — and your position depends on factors generic calculators ignore: productized service offerings, recurring retainer revenue above 60%, whether you are still the rainmaker, and client concentration below 20% per account.
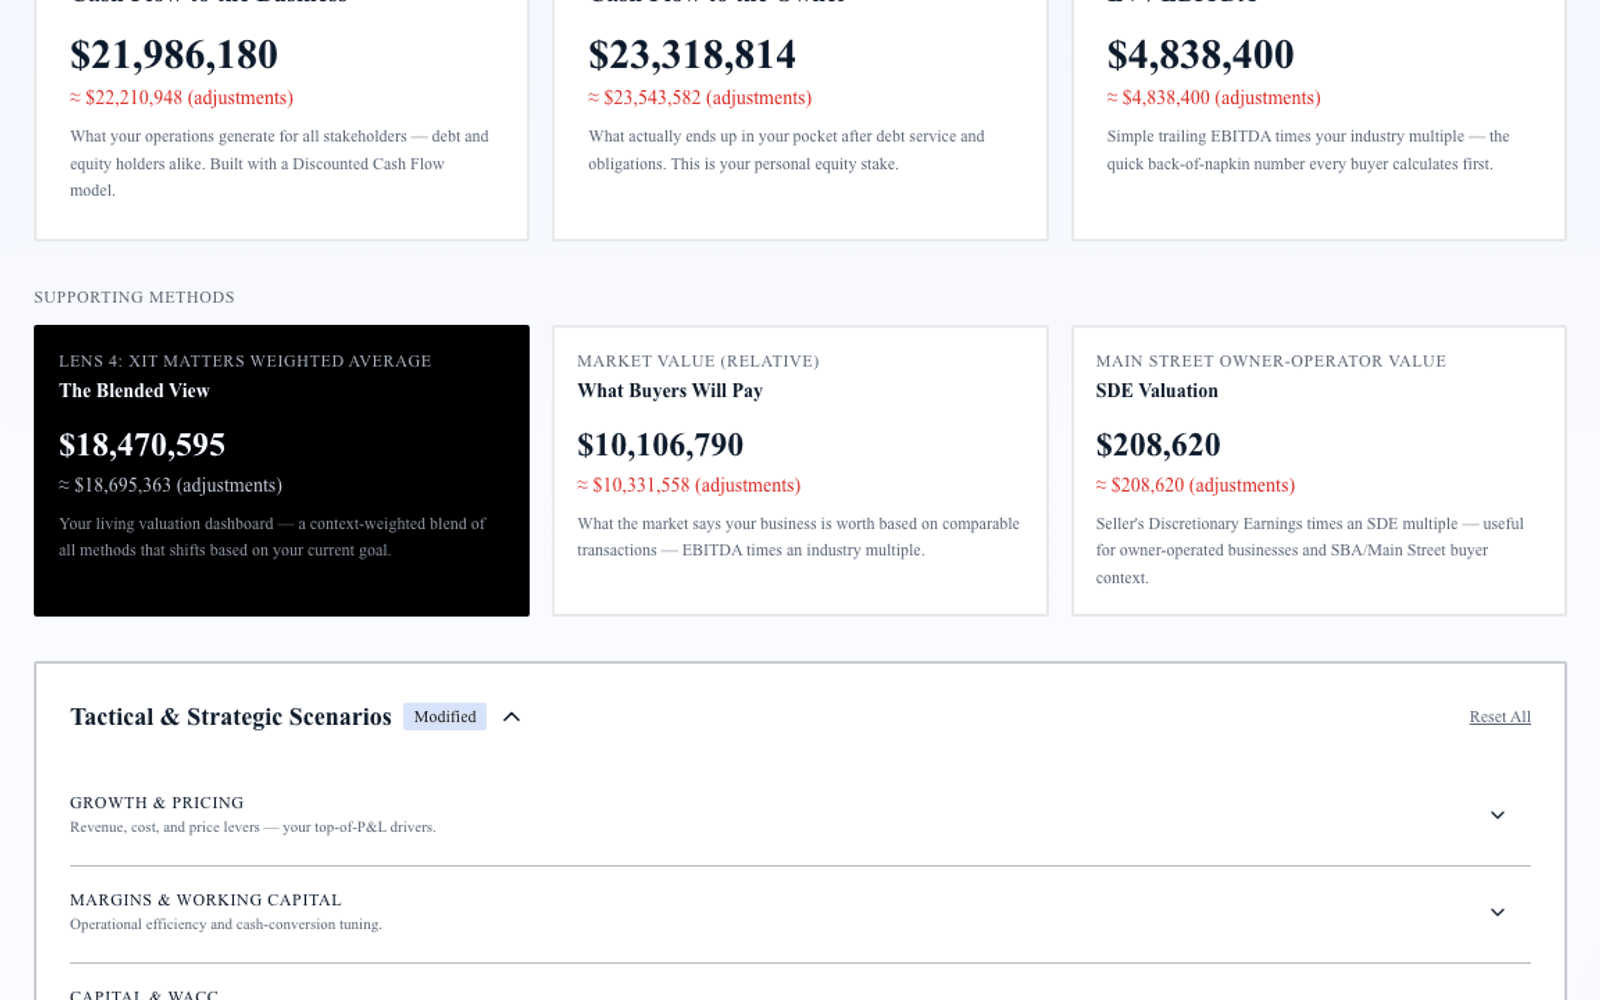
Exit Matters Chapter 6 explains what buyers pay for — reduced risk, visible cash flow, owner-independent delivery. Chapter 7 blends FCFF, FCFE, and EV/EBITDA into one decision compass. A valuation calculator for agency owners must run all three on your books and expose agency-specific drivers.
Agencies with productized retainers and category specialization — performance marketing for D2C, for example — trade highest. Project-only shops compress toward the low end regardless of creative reputation.
The 2026 agency multiple band — 2.5× to 6.5× on normalized EBITDA
Low end (2.5×–3.2×). Project-based revenue with no retainers, owner is the rainmaker, single-vertical client mix with concentration risk, lumpy quarterly billings.
Median (4.0×). Retainer revenue above 50%, documented delivery SOPs, account team bench beyond the founder, clean two-year financials with utilization reconciliation.
High end (5.0×–6.5×). Productized service offering, recurring retainer revenue above 60%, senior team less than 60% owner-dependent, diversified client base with renewal data.
Why a single multiple is not enough — run three institutional lenses
FCFF captures unlevered cash after working-capital swings from WIP and receivables timing common in agency billing. Strong Q4 billings with slow collection depress near-term FCFF even when EBITDA looks healthy.
FCFE answers equity walk-away after any acquisition line or partner buyout notes. Agency owners often confuse enterprise value with cash after earnout holdbacks; FCFE keeps that clear.
EV/EBITDA anchors to what holding companies and strategic acquirers pay — the language M&A advisors use in agency roll-ups.
The Blended View shifts weight between reinvesting in productized offers versus preparing for sale to a platform buyer.
Agency-specific levers the calculator must expose
Retainer versus project mix. Model shift from 45% to 65% retainer revenue and measure multiple band response — structural premium driver.
Rainmaker dependency. Quantify BD hire or sales process documentation; key-person discount often costs one full turn on EBITDA.
Client concentration. Top client above 25% triggers discount. Scenario two mid-market wins dropping concentration below 15%.
Utilization and delivery margin. Normalize contractor spend and owner delivery hours priced below market. Clean EBITDA before calculator input.
Productized offers. Fixed-scope packages with documented margin support premium placement versus custom scopes every engagement.
A worked example — performance marketing agency, $5.4M revenue
Consider a performance marketing agency, $5.4M revenue, $1.05M normalized EBITDA, 58% retainer revenue, founder still primary rainmaker closing 55% of new business, top client at 22% of revenue, 62% gross margin on delivery.
Generic 4× EBITDA yields $4.2M.
Three-method run: FCFF $3.6M–$4.2M given receivables timing. FCFE $3.3M–$3.9M. EV/EBITDA at 3.4×–4.2× given rainmaker risk implies $3.57M–$4.41M. Blended seller weighting $3.65M–$4.25M.
Highest-ROI fixes: hire BD lead, push retainers to 68%, drop top client below 18% — each scenario measurable before broker fees.
Step-by-step — institutional valuation for digital agencies
Step 1 — Normalize EBITDA. Remove owner perks, one-time rebrand spend, and pass-through media misclassified as revenue. Add back depreciation on equipment. Adjust owner compensation to market-rate agency principal or remove entirely if you are modeling post-founder delivery.
Step 2 — FCFF for agencies. Agencies carry receivables timing from net-30 and net-45 client terms. Model DSO explicitly; strong Q4 billings with January collection lag depress near-term FCFF. Subtract net working capital investment when WIP grows on fixed-fee projects.
Step 3 — FCFE after deal structure. Enter any acquisition line, partner buyout note, or equipment lease. Earnout holdbacks reduce near-term FCFE even when headline EV looks attractive — model base and upside scenarios separately.
Step 4 — EV/EBITDA band placement. At 4.0× median on $1.05M EBITDA, enterprise value is $4.2M before rainmaker and concentration discounts move you within the 2.5×–6.5× band. Productized retainers above 60% support median-to-premium; project-only shops compress toward 2.5×–3.2×.
Step 5 — Blended View for agency owners. Agency-owner reinvest weighting emphasizes FCFF when hiring delivery bench; seller weighting emphasizes EV/EBITDA for holding-company exit. Run both before signing exclusivity.
How XIT Matters delivers an agency valuation calculator
XIT Matters ships the agency band (2.5× low, 4.0× median, 6.5× high) with premium and discount drivers visible.
Real-Time Slider Modeling adjusts retainer mix, client concentration, rainmaker dependency, and growth visibility.
Six Persona Views switch agency-owner reinvest versus seller weighting.
AI Scenario Analyst: "What if I productized our audit offer at $8K/month retainer?" — maps revenue mix and multiple together.
Cost of Capital Simulator for any acquisition financing scenarios.
QuickBooks or Xero compatible or manual entry in about ten minutes. Free during beta.
Preparing agency financials before you calculate
Two years P&L with client-level margin if available, balance sheet, trailing cash flow. Normalize owner compensation, remove one-time conference and rebrand spend, separate pass-through media spend from agency revenue. Document renewal rates by cohort.
When an agency valuation calculator is enough — and when it is not
Use for sale prep, partnership buyouts, holding-company conversations, and prioritizing productization. Budget QoE or formal appraisal for signed LOI diligence or litigation.
Increasing agency value before you sell
Fix rainmaker dependency and retainer mix first, then productize highest-margin offer. Model each fix; rank by blended delta. Eighteen months of documented retainer growth often moves multiples more than waiting for market lift.
Earnouts and holdbacks — agency deal structures
Many agency sales include earnouts tied to client retention. Model base versus upside scenarios in FCFE so walk-away math reflects reality, not headline enterprise value alone.
Utilization cycles and FCFF for agencies
Utilization spikes around launches depress FCFF in heavy delivery quarters even when EBITDA holds. Normalize across trailing twelve months; stress-test a client loss scenario on top-three accounts.
When to refresh your agency valuation
Re-run after major client win or loss, productized offer launch, BD hire, or crossing $3M with 65%+ retainer mix. Quarterly refresh during exit prep keeps conversations aligned.
Holding-company roll-ups versus strategic sale — choosing the right lens
Agency holding companies underwrite retainer durability and cross-sell potential across their portfolio; strategic acquirers underwrite client overlap and delivery integration cost. A valuation calculator for agency owners should support persona weighting that shifts toward EV/EBITDA for platform buyers and FCFF when you are evaluating whether to reinvest margin in a second service line versus take dividends. Model both exit paths before signing exclusivity with any one advisor type.
Pass-through media spend and revenue normalization
Agencies that pass through large media buys can inflate headline revenue without proportional margin. Normalize to net agency revenue — fee and margin on spend, not gross billings — before entering financials. Buyers rebuild this in QoE regardless; starting clean prevents a 15–25% surprise haircut on enterprise value at diligence. Separate contractor pass-through from employee delivery cost for true utilization math.
Case studies, awards, and intangible premium — what moves the band
Creative awards and case studies do not replace retainer economics, but documented case studies that sell without the founder in the room reduce rainmaker discount. Invest in three productized case-study packages with measurable client outcomes before exit; model rainmaker dependency reduction in dollars, not vanity metrics.
Client churn and replacement cost — FCFF sensitivity
Agency client loss often triggers simultaneous revenue drop and re-selling cost in the same quarter. Stress-test loss of your second-largest client: does FCFE still support earnout thresholds you might accept in a platform sale? Running that scenario before term sheet negotiation prevents accepting earnout structures you cannot hit if one logo leaves.
Offshore delivery and margin expansion
Nearshore or offshore delivery benches can expand delivery margin when quality and client communication remain stable — a premium driver when documented across four quarters with client retention above 90%. Model margin improvement from 62% to 68% delivery gross margin with bench investment; compare blended delta against raising retainer prices 5%.
Platform integration and tech stack — diligence topics buyers raise early
Agency buyers ask about martech stack portability, data ownership, and client access credentials before they ask about creative awards. Document which platforms you control versus client-owned accounts; transition risk compresses multiples when buyers model three months of client re-permissioning work. A valuation calculator for agency owners paired with clean operational documentation prevents re-trade on integration cost assumptions that never appeared in a revenue-multiple guess.
Closing note for agency owners
Your agency deserves more than a professional-services guess. Run the agency band, normalize earnings, model retainer and rainmaker fixes, refresh quarterly. XIT Matters is free during beta, built from Exit Matters methodology, ready in about ten minutes. Start with normalized trailing-twelve-month EBITDA — buyers average client retention, not your best quarter. Before you hire a broker, run three scenarios: status quo, retainer push to 68%, and rainmaker hire with documented BD pipeline. Rank by blended delta and execute the highest-ROI fix first — that sequence often moves you one full turn on the multiple band within four quarters.
Creative versus media mix — margin quality buyers underwrite
Agencies heavy on pass-through media with thin management fees trade differently from creative-led shops with strong delivery margin. Normalize fee revenue separately from billable media; buyers apply different multiples to each stream in sophisticated diligences. A valuation calculator for agency owners should reflect fee margin, not gross billings — starting with net agency revenue prevents listing at a number that collapses when media pass-through is stripped out.
Employee turnover and knowledge transfer risk
High account-team turnover triggers discount because buyers model client re-selling cost. Document account plans, creative libraries, and transition SOPs; model turnover reduction as a slider input where bench depth improves. Replacing two senior account directors with documented handoff protocols can move blended value more than a single marquee client win if retention data supports the claim.
Niche vertical specialization — premium path
Agencies specializing in one vertical — healthcare compliance marketing, fintech performance, B2B SaaS demand gen — often command premium multiples when retention and case studies prove repeatable playbooks. Enter vertical concentration honestly; specialization above 60% with strong renewal supports median-to-high placement when delivery margin holds above 55%.
Holding-company integration cost — seller preparation
Platform buyers model integration cost for finance, HR, and reporting systems. Clean chart of accounts, client contracts in standard form, and utilization tracking reduce perceived integration risk — soft factors that show up as multiple compression in LOI when missing. Prepare those assets before calculator output goes to a broker; the range you defend should assume buyer-side integration cost is minimal because you already did the work. That preparation alone can preserve 0.2×–0.3× on the multiple when holding-company buyers compare your shop to less organized targets.