Valuation calculator for e-commerce stores — why marketplace multiples misprice your brand
If you need a valuation calculator for e-commerce stores, a revenue × 2.5 widget from an aggregator forum will misprice your brand before you finish entering Shopify gross sales. E-commerce businesses trade on normalized EBITDA within a rational band — low 2.0×, median 3.5×, high 5.5× for typical Main-Street to lower-middle-market deals in the $1M–$20M revenue range — and your position within that band depends on factors generic calculators ignore: repeat customer revenue above 40%, branded product versus resell mix, channel diversification beyond Amazon, and gross margin above 35% with healthy inventory turns.
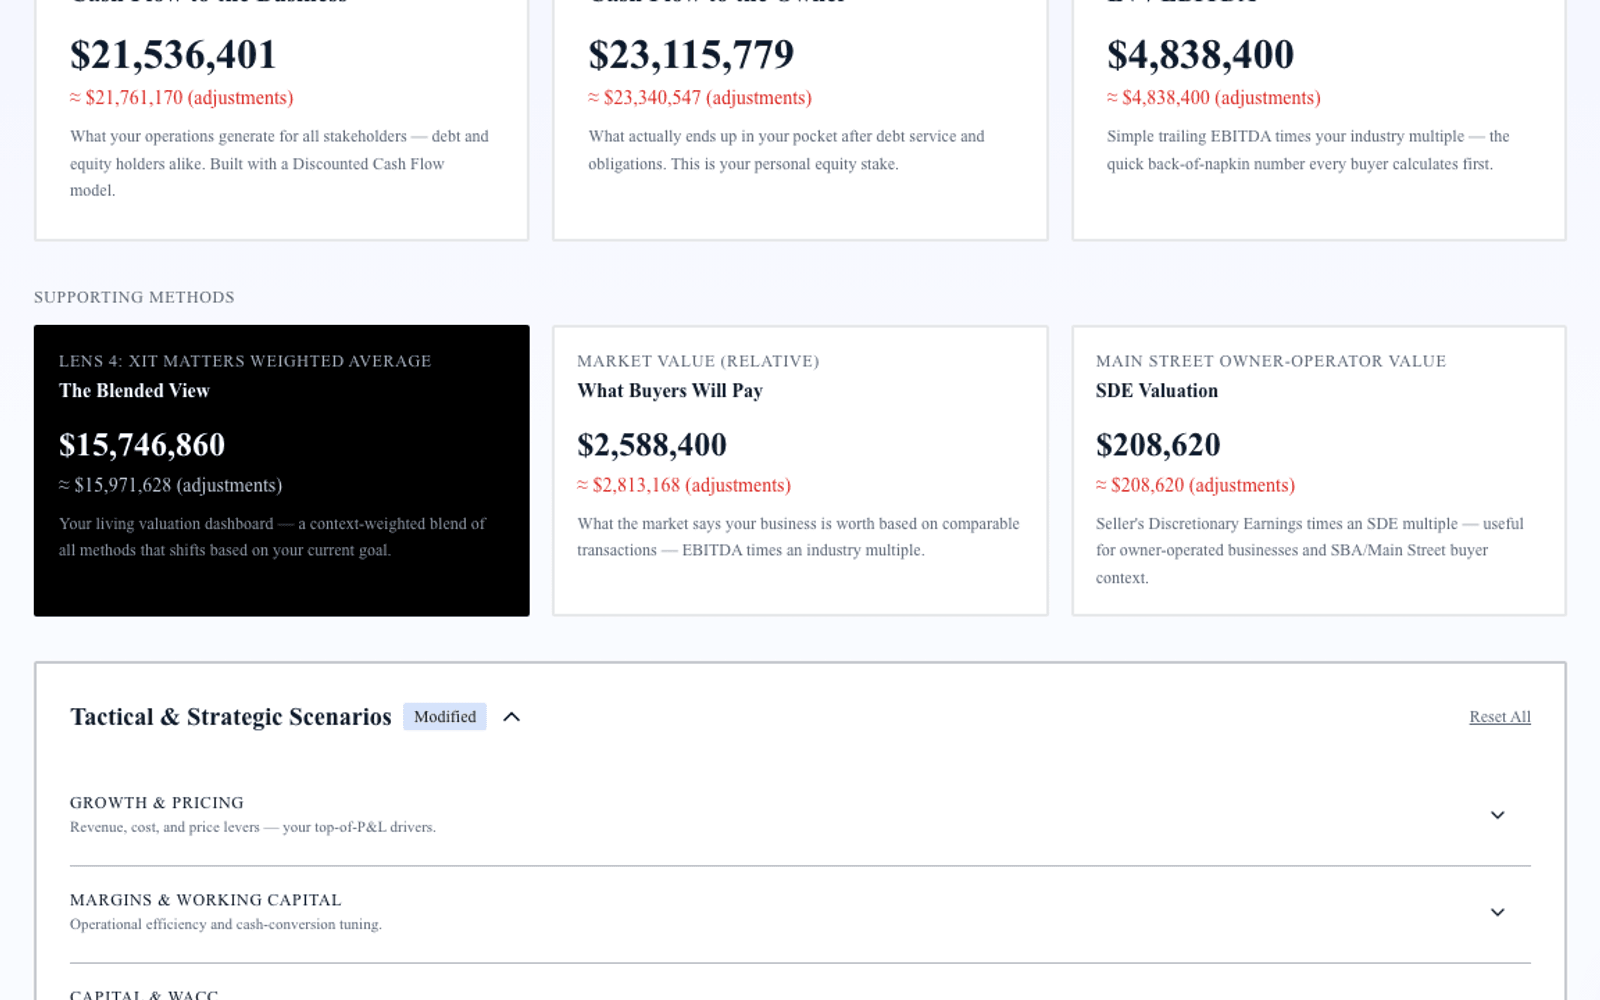
Exit Matters Chapter 7 frames the Blended View — three institutional methods weighted toward your decision. Chapter 9 covers tactical levers — pricing, fulfillment cost, working capital — that move earnings quality before a multiple ever applies. A valuation calculator for e-commerce stores must run all three methods on normalized financials and expose the e-commerce-specific drivers, not an aggregator-era headline.
Aggregator demand cooled in 2024–25; 2026 multiples rebuilt around proven brand strength rather than growth alone. Your calculator should reflect that shift.
The 2026 e-commerce multiple band — 2.0× to 5.5× on normalized EBITDA
Current SMB e-commerce transaction data clusters into a band most owners never see until diligence.
Low end (2.0×–2.8×). Single-channel dependency on one marketplace, sub-25% gross margin, inventory-heavy with poor turnover, no repeat purchase data.
Median (3.5×). Branded product portfolio with defensible margin, mix of DTC and wholesale, repeat customer revenue above 30%, clean two-year financials with channel reconciliation.
High end (4.5×–5.5×). Repeat customer revenue above 40%, diversified channel mix beyond any single platform, subscription or replenishment revenue with documented cohort retention.
Why a single multiple is not enough — run three institutional lenses
Free Cash Flow to the Firm (FCFF) projects unlevered cash after maintenance capex on fulfillment systems and inventory investment. E-commerce ties significant cash in inventory and receivables from wholesale accounts; days inventory outstanding and payment processor timing flow directly into FCFF.
Free Cash Flow to Equity (FCFE) answers what equity holders receive after inventory lines of credit, equipment loans, and merchant cash advances. Many e-commerce owners confuse enterprise value with walk-away cash after inventory debt; FCFE keeps that boundary sharp.
EV/EBITDA anchors to what acquirers and strategic buyers pay — the language brokers and brand roll-ups speak. The multiple adjusts for channel mix, gross margin, repeat revenue, and owner dependency in marketing.
The Blended View combines the three with weights that shift for reinvestment versus exit. Owner reinvest weighting emphasizes FCFF for warehouse expansion; seller weighting emphasizes EV/EBITDA for strategic acquirer conversations.
E-commerce-specific levers the calculator must expose
Channel mix. Enter DTC, marketplace, wholesale, and retail percentages separately. Shifting 15% of revenue from marketplace to owned DTC with higher margin often expands blended value more than raw revenue growth on thin margin.
Repeat customer revenue. Above 40% repeat revenue supports premium placement. Model loyalty program or subscription launch and measure multiple band response.
Gross margin and fulfillment. Enter product margin net of shipping, returns, and payment fees. Margin improvement from 3PL renegotiation or SKU rationalization flows through FCFF and EV/EBITDA together.
Inventory quality. Slow-moving SKUs get written down in diligence. Scenario inventory write-down before sale and see FCFE impact — clean inventory before data room opens.
Owner dependency in marketing. When the founder is the brand face and primary media buyer, buyers underwrite key-person risk. Document agency transition or hire media lead; quantify multiple expansion.
A worked example — DTC apparel brand, $6.8M revenue
Consider a DTC apparel brand, $6.8M revenue, $920K normalized EBITDA, 38% gross margin, 52% repeat customer revenue, 55% DTC and 45% Amazon, founder still primary media buyer, inventory turns at 4.2× annually.
A generic calculator might apply 3.5× EBITDA and output $3.22M.
Running three methods: FCFF might land $2.9M–$3.4M given inventory intensity. FCFE after inventory LOC might sit $2.6M–$3.1M. EV/EBITDA at 3.2×–3.9× given Amazon mix implies $2.94M–$3.59M. Blended under seller weighting might converge $2.95M–$3.45M.
The owner sees highest-ROI fixes: reduce Amazon to 35% with DTC growth, hire media lead, improve turns to 5× — each measurable in dollars.
Step-by-step — running FCFF, FCFE, and EV/EBITDA on e-commerce financials
Step 1 — Normalize EBITDA. Start with operating income, add back depreciation, then apply e-commerce-specific adjustments. Add back owner compensation above a market-rate e-commerce operator salary. Remove one-time launch campaigns, influencer spikes, and non-recurring warehouse setup. Subtract maintenance capex on Shopify apps, photography, and fulfillment equipment. Adjust related-party rent if you operate from owner-controlled warehouse space.
Step 2 — Build FCFF. Apply effective tax rate to normalized EBITDA after maintenance capex. Add back non-cash charges. Subtract net working capital investment — inventory builds, wholesale receivables, and payment processor float. E-commerce working capital is rarely zero; model DIO and DSO explicitly.
Step 3 — Derive FCFE. Subtract interest on inventory lines and equipment loans after tax. Add net debt issuance if you are modeling refinance scenarios. Equity walk-away equals enterprise value minus net debt plus or minus working-capital peg assumptions at close.
Step 4 — Anchor EV/EBITDA. Apply the 2.0×–5.5× band position based on repeat revenue, channel mix, and gross margin. At 3.5× median on $920K EBITDA, enterprise value lands at $3.22M before discount drivers adjust placement within the band.
Step 5 — Blend the three. Weight FCFF for warehouse expansion decisions, EV/EBITDA for strategic acquirer conversations, FCFE for personal walk-away after inventory debt. Divergence between methods often reveals channel margin misstatement or inventory overstatement — fix those before listing.
How XIT Matters delivers an e-commerce valuation calculator
XIT Matters ships the e-commerce band (2.0× low, 3.5× median, 5.5× high) with premium and discount drivers beside the multiple slider.
Real-Time Slider Modeling adjusts repeat revenue, channel mix, gross margin, and inventory turns — every move recalculates FCFF, FCFE, EV/EBITDA, and blended headline.
Six Persona Views switch between owner reinvest and seller pre-market weighting.
The AI Scenario Analyst accepts: "What if I cut Amazon to 30% and DTC margin improved 4 points?" — mapping channel, margin, and multiple together.
Cost of Capital Simulator exposes WACC so inventory LOC refinance flows through FCFF.
QuickBooks or Xero compatible entry or manual financials in about ten minutes. Free during beta.
Preparing e-commerce financials before you calculate
Gather two years of P&L with channel reconciliation, balance sheet with inventory aging, trailing cash flow. Normalize owner compensation, remove one-time photo shoots and launch marketing, separate COGS from shipping and returns for true gross margin. Write down aged inventory before presenting.
When an e-commerce valuation calculator is enough — and when it is not
Use for sale preparation, partnership buyouts, SBA anchoring, and prioritizing channel fixes. Budget formal appraisal or QoE for signed LOI diligence, litigation, or estate contexts.
Increasing e-commerce value before you sell
Fix single-channel dependency and margin first, then grow repeat revenue above 40%. Model each fix; rank by blended delta. Eighteen months of documented DTC shift often moves multiples more than promotional revenue spikes.
Returns, chargebacks, and net revenue normalization
E-commerce returns and chargebacks belong in normalized revenue before EBITDA. A valuation calculator for e-commerce stores must treat net revenue, not gross merchandise value, as the anchor — buyers rebuild from net in diligence regardless of how you report internally.
Seasonality and inventory build — FCFF timing for online retail
Peak seasons build inventory before revenue arrives. Stress-test Q4 build against Q1 cash conversion; buyers underwrite slow-quarter FCFE. Running that scenario first prevents surprise price adjustments at LOI.
When to refresh your e-commerce valuation
Re-run after major channel shift, 3PL change, SKU rationalization, crossing $5M with positive EBITDA, or launching subscription replenishment. Quarterly refresh during exit prep keeps broker conversations current.
Wholesale, retail, and omnichannel — expanding beyond DTC-only models
E-commerce stores with wholesale or retail partnerships carry different margin and working-capital profiles than pure DTC. A valuation calculator for e-commerce stores must let you enter wholesale as a distinct channel with its own margin and payment terms — net-60 wholesale receivables tie cash differently than same-day DTC card capture. Model a shift from 70% DTC to 55% DTC plus 15% wholesale with documented account relationships; buyers underwrite wholesale concentration separately from marketplace dependency.
Brand equity and CAC payback — premium drivers beyond revenue
Repeat customer revenue above 40% is the headline premium driver, but documented CAC payback under twelve months on paid channels and organic search moats support median-to-high placement when gross margin holds. Enter marketing efficiency assumptions and stress-test a CAC inflation scenario: if paid ROAS drops 20% while repeat revenue holds, does blended value still support your asking price? Running that before diligence prevents re-trade on marketing efficiency questions.
3PL, fulfillment, and margin normalization
Third-party logistics fees belong in normalized COGS, not buried in opex. Reclassify fulfillment consistently across two years before running the calculator — buyers rebuild margin line by line. A shift from in-house to 3PL may depress near-term EBITDA while improving scalability; model both states and show buyers the path to premium band placement with documented unit economics per order.
Strategic acquirer versus financial buyer — persona weighting
Strategic acquirers weight synergies and channel access; financial buyers weight EBITDA and working-capital discipline. Six Persona Views let you switch seller weighting toward EV/EBITDA for strategic conversations and FCFF-heavy blends for holdco buyers. Same store, different headline — both defensible when methodology is transparent.
Closing note for e-commerce store owners
Your brand deserves more than a marketplace multiple. Run the e-commerce band, normalize net revenue and margin, model channel and repeat-customer fixes, refresh quarterly. XIT Matters is free during beta, built from Exit Matters methodology, ready in about ten minutes. Start with normalized trailing-twelve-month EBITDA on net revenue — buyers do. Tie every slider move to a operational decision you can execute this quarter: cut a low-margin SKU, renegotiate 3PL terms, launch replenishment on your top three products. A valuation calculator for e-commerce stores earns its keep when it ranks those fixes by dollar impact on blended value, not when it prints a single number you cannot defend in LOI diligence.
Paid acquisition efficiency and blended valuation
Customer acquisition cost payback period affects how buyers underwrite growth — not just headline revenue. When CAC payback stretches beyond eighteen months on paid social while organic repeat revenue holds, FCFF compresses even if monthly revenue looks flat. Model a scenario where paid spend drops 20% and repeat revenue rises 5 points; compare blended delta against launching a subscription box on your hero SKU. The ranking tells you whether to fix acquisition efficiency or retention first — the same question strategic acquirers ask in management presentations.
International and multi-currency considerations
Stores selling across borders carry FX, duty, and returns complexity that generic calculators ignore. Normalize revenue to a single reporting currency before running EV/EBITDA; buyers rebuild FX exposure in diligence. If cross-border exceeds 25% of revenue, stress-test a tariff or shipping-cost spike scenario — FCFE sensitivity often surprises owners who only modeled domestic DTC growth.
Packaging, bundling, and average order value
AOV expansion through bundling improves gross margin per shipment when fulfillment cost is semi-fixed — a tactical lever Chapter 9 emphasizes. Model a bundle strategy that lifts AOV 15% without increasing return rate; watch FCFF respond through margin and working-capital per order. Bundling that increases turns and margin together often supports median-to-premium band movement faster than raw traffic growth alone.