Valuation calculator for manufacturing businesses — why commodity multiples misprice your shop floor
If you need a valuation calculator for manufacturing businesses, a broad industrial EBITDA × 4 guess will misprice your operation before you enter last year's production report. Manufacturers trade on normalized EBITDA within a rational band — low 3.0×, median 4.5×, high 7.0× for typical Main-Street to lower-middle-market deals in the $3M–$50M revenue range — and your position depends on specialty end-market exposure, long-term customer contracts, equipment age and remaining capex, and whether a single OEM dominates your revenue.
Exit Matters Chapter 7 frames the Blended View. Chapter 8 covers cost of capital — WACC and credit spread drivers that move FCFF when you refinance equipment debt or shift capital structure. Specialty manufacturers with regulated end markets — aerospace, medical — trade well above general fabrication. Your calculator must reflect that spread.
The 2026 manufacturing multiple band — 3.0× to 7.0× on normalized EBITDA
Low end (3.0×–3.8×). Single large OEM customer above 40% of sales, aging equipment with five-plus year capex catch-up, tariff-exposed supply chain without mitigation, general fabrication with commodity pricing.
Median (4.5×). Diversified customer mix, documented maintenance capex program, long-term contracts covering 50%+ of capacity, clean two-year financials with inventory reconciliation.
High end (5.5×–7.0×). Specialty or regulated end-market exposure, modern equipment with low remaining capex, multi-year contracts with price escalation, quality certifications buyers require.
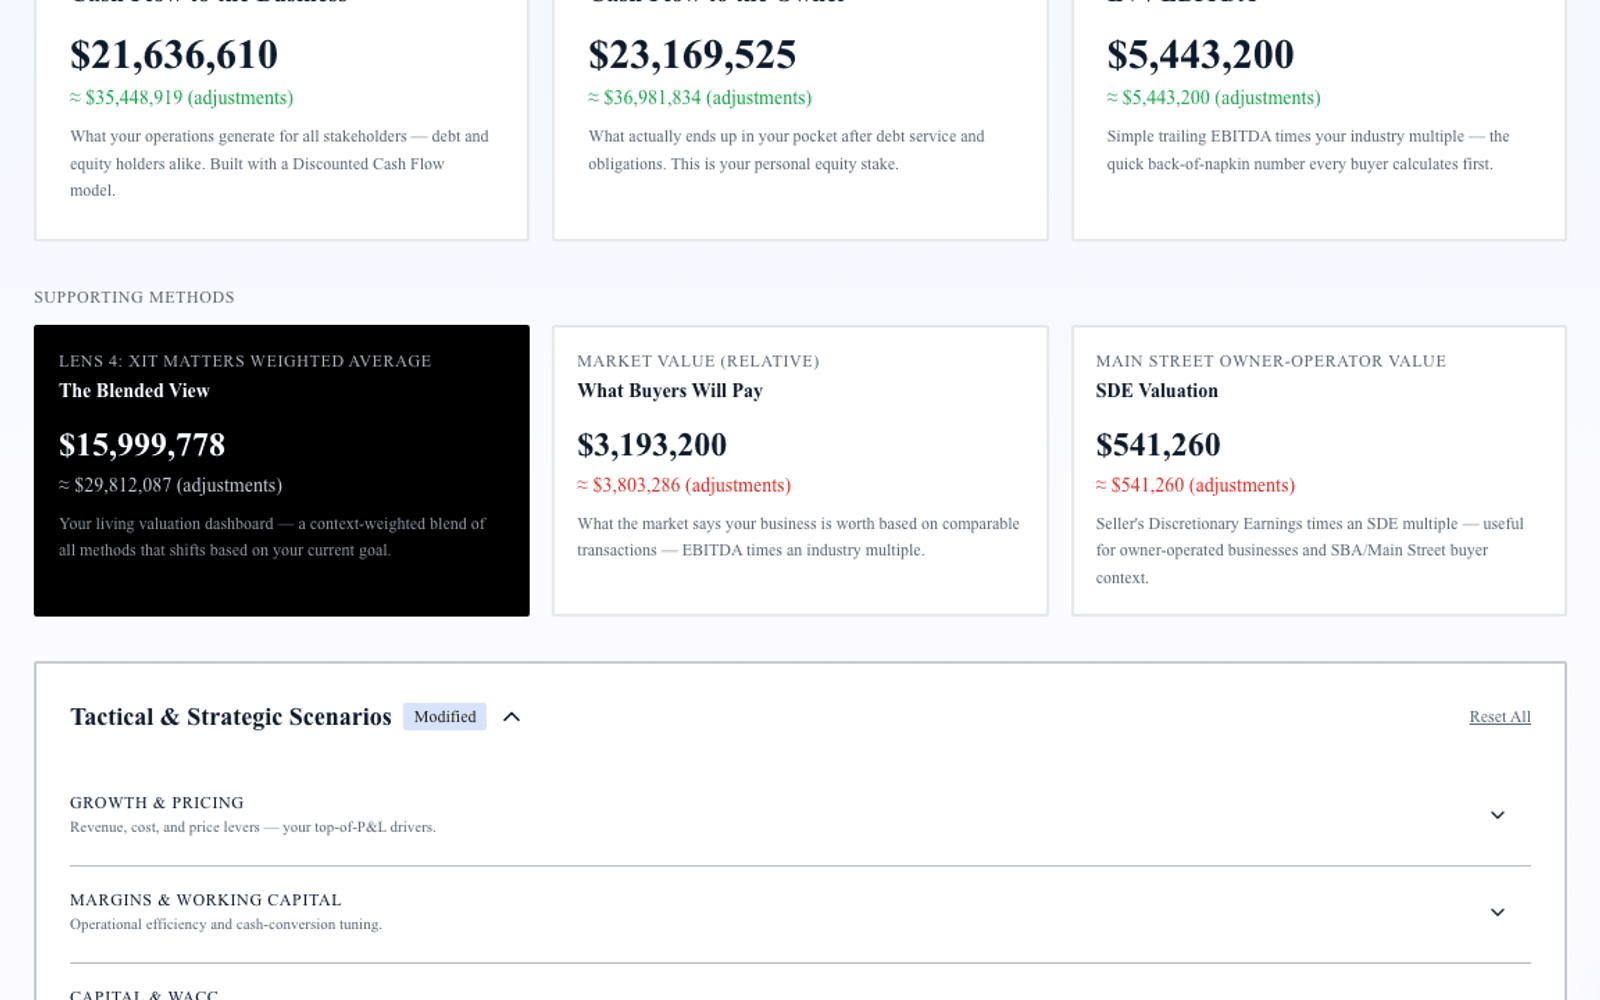
Why a single multiple is not enough — run three institutional lenses
FCFF captures unlevered cash after maintenance capex — non-negotiable for going-concern manufacturing — and net working capital investment in inventory and receivables. Heavy raw-material builds before production runs depress near-term FCFF even when EBITDA holds.
FCFE answers equity walk-away after equipment loans, inventory lines of credit, and any SBA or seller notes. Owners often confuse enterprise value with cash after equipment debt; FCFE keeps that boundary sharp.
EV/EBITDA anchors to what strategic acquirers and PE roll-ups pay — the language industrial M&A advisors speak.
The Blended View shifts weight between capacity expansion decisions versus preparing for sale to a platform buyer.
Manufacturing-specific levers the calculator must expose
Customer concentration. Model drop from 45% to 22% top-customer share with two new contract wins; concentration discount often costs 1.5 turns on EBITDA.
Maintenance versus growth capex. Separate required equipment upkeep from discretionary expansion. Buyers haircut FCFF when maintenance was deferred.
Equipment age and utilization. Modern CNC with documented uptime supports premium; aging fleet with catch-up need compresses.
End-market specialty. Regulated or aerospace exposure supports high band; commodity fabrication compresses.
Working capital intensity. DSO, DIO, and DPO flow directly into FCFF — model inventory turns and customer payment terms explicitly.
A worked example — precision machining shop, $12M revenue
Consider a precision machining shop serving medical device OEMs, $12M revenue, $1.85M normalized EBITDA, top customer at 28% of sales, equipment average age seven years with $400K maintenance capex need over three years, 46-day DSO, ISO certification documented.
Generic 4.5× EBITDA yields $8.33M.
Three-method run: FCFF $6.8M–$7.8M after maintenance capex and working capital. FCFE $6.2M–$7.2M after equipment debt. EV/EBITDA at 4.0×–5.2× given capex backlog implies $7.4M–$9.62M range before capex haircut on FCFF convergence. Blended seller weighting $7.2M–$8.4M.
Highest-ROI fixes: execute maintenance plan, land second medical OEM below 18% concentration, document contract backlog — measurable before broker engagement.
Step-by-step — FCFF, FCFE, and EV/EBITDA for manufacturers
Step 1 — Normalize EBITDA. Add back depreciation on equipment. Adjust owner compensation above plant-manager market rate. Remove one-time tooling, relocation, and environmental remediation already completed. Subtract maintenance capex required to sustain current production capacity — not discretionary expansion lines.
Step 2 — FCFF with working capital and capex. Manufacturing FCFF ties directly to inventory, WIP, raw material builds, and receivables from OEM customers. Model DSO, DIO, and DPO explicitly. A strong production quarter that builds raw inventory before shipment depresses FCFF even when EBITDA holds.
Step 3 — FCFE after equipment debt. Enter term loans on CNC and fabrication equipment, inventory lines of credit, and any SBA or seller notes. Equity walk-away equals enterprise value minus net debt adjusted for working-capital peg at close.
Step 4 — EV/EBITDA band. At 4.5× median on $1.85M EBITDA, enterprise value is $8.33M before customer concentration and capex backlog adjust placement within 3.0×–7.0×. Specialty medical and aerospace exposure supports premium; commodity fabrication compresses.
Step 5 — Blended View for manufacturing owners. Weight FCFF for automation and capacity decisions; weight EV/EBITDA for PE roll-up and strategic acquirer processes. Divergence often reveals deferred maintenance or OEM concentration — fix before data room.
How XIT Matters delivers a manufacturing valuation calculator
XIT Matters ships the manufacturing band (3.0× low, 4.5× median, 7.0× high) with premium and discount drivers visible.
Real-Time Slider Modeling adjusts customer concentration, maintenance capex, DSO, DIO, and industry multiple position.
Six Persona Views for owner reinvest versus seller weighting.
AI Scenario Analyst: "What if we invested $350K in CNC upgrade and DSO dropped to 38 days?" — maps capex, working capital, and multiple together.
Cost of Capital Simulator for equipment refinance scenarios.
QuickBooks or Xero compatible or manual entry in about ten minutes. Free during beta.
Preparing manufacturing financials before you calculate
Two years P&L with cost-of-goods detail, balance sheet with inventory aging, trailing cash flow, equipment schedule with age and remaining useful life. Normalize owner compensation, remove one-time tooling and relocation, separate maintenance from expansion capex in buyer materials. Document customer contracts and certification status.
When a manufacturing valuation calculator is enough — and when it is not
Use for sale prep, SBA anchoring, partnership buyouts, capacity planning, and prioritizing capex. Budget formal appraisal or QoE for signed LOI diligence, litigation, or IRS estate filing.
Increasing manufacturing value before you sell
Fix customer concentration and deferred maintenance first, then document specialty end-market credentials. Model each fix; rank by blended delta. Twenty-four months of documented capex discipline often moves multiples more than a single strong production year on aging assets.
Inventory and WIP — manufacturing FCFF mechanics
Work-in-process and raw inventory builds affect FCFF seasonally. A valuation calculator for manufacturing businesses must capture inventory investment or FCFF misstates cash in ramp quarters. Normalize trailing twelve months; stress-test a supply-chain disruption scenario.
Tariff and supply-chain exposure
Tariff-exposed supply chains without mitigation compress multiples in 2026 underwriting. Model pass-through pricing power and alternate sourcing scenarios before buyer diligence asks the same questions.
When to refresh your manufacturing valuation
Re-run after major contract win or loss, equipment upgrade, certification renewal, or crossing $5M EBITDA with diversified customer mix. Quarterly refresh during exit prep.
Quality systems and certifications — premium evidence
ISO, AS9100, ITAR, and medical-device quality certifications support premium band placement when documented with audit history and customer requirements. Enter certification status when interpreting the 3.0×–7.0× band; general job shops without quality systems compress toward low end even at similar EBITDA margins.
Environmental and regulatory capex — hidden FCFF drains
Environmental remediation, emissions compliance, and safety upgrades can create capex drains buyers model into normalized FCFF even when not visible in trailing EBITDA. Document three-year compliance capex plan before running numbers; surprises in diligence re-trade enterprise value aggressively.
Sale-leaseback and real estate separation
Manufacturers who own real estate often debate carving property from operating business. A valuation calculator for manufacturing businesses should support scenarios where real estate is excluded from EV — model operating company EBITDA separately from property value or lease-back rent adjustment. Above-market rent on sale-leaseback compresses operating EV; below-market owned facility may be carved out in some structures.
Backlog visibility and production scheduling
Backlog visibility above twelve months supports premium drivers for specialty manufacturers with long lead times. Enter contracted backlog months when interpreting multiple placement; lumpy project shops without backlog compress toward general fabrication multiples regardless of last year's EBITDA spike.
PE roll-up versus strategic acquirer — weighting the Blended View
PE roll-ups underwrite EBITDA and capex discipline; strategics underwrite synergy and capacity. Shift Blended View weight toward EV/EBITDA for strategic conversations and FCFF-heavy analysis when evaluating reinvestment in automation versus dividend extraction.
Spare capacity and overtime — normalizing labor before EBITDA input
Overtime spikes and underutilized shifts distort normalized EBITDA when buyers model sustainable labor cost. Normalize to standard capacity utilization across trailing twelve months; document where second shift or automation would change unit cost. A valuation calculator for manufacturing businesses reflects earnings quality only when labor normalization matches what QoE will rebuild — otherwise blended output overshoots market by 10–20% and re-trades at LOI.
Closing note for manufacturing business owners
Your shop floor deserves more than a commodity multiple. Run the manufacturing band, normalize EBITDA with honest capex, model concentration and equipment fixes, refresh quarterly. XIT Matters is free during beta, built from Exit Matters methodology, ready in about ten minutes. Start with normalized trailing-twelve-month EBITDA after maintenance capex — buyers do. SBA and strategic buyers both ask the same follow-up: can this EBITDA repeat without catch-up capex? Answer with FCFF, not hope — and rank equipment and customer-diversification fixes by blended delta before you list.
Automation and labor productivity — premium drivers on the plant floor
Documented automation ROI — cycle time reduction, scrap rate improvement, labor hours per unit — supports premium band placement when metrics hold across four quarters. Model a $280K automation investment with 18-month payback; compare blended delta against adding a second shift on labor alone. Buyers underwrite sustainable unit economics, not temporary overtime spikes that inflate EBITDA without repeating.
Supply chain redundancy and tariff mitigation
Single-source raw material suppliers compress multiples when tariff or logistics disruption risk is visible. Document dual sourcing for critical inputs and model a 8% input-cost spike scenario; FCFF sensitivity shows whether margin can absorb shock without covenant breach. Mitigation plans buyers can verify in diligence often prevent re-trade more than optimistic EBITDA add-backs.
Quality reject rates and warranty reserves
Elevated reject rates and warranty claims signal process-control risk buyers normalize into EBITDA. Track reject PPM and warranty as percent of revenue; clean trends support median placement while rising warranty expense triggers discount. Normalize warranty reserves before calculator input — QoE will rebuild regardless.
Environmental liabilities and phase-one assumptions
Undocumented environmental exposure on owned real estate creates tail risk that compresses EV in sophisticated buys. Phase-one environmental reports and documented remediation completion remove discount; enter owned-facility status when modeling FCFE if sale includes real estate versus asset-only operating company sale.
SBA eligibility and debt service coverage
SBA 7(a) buyers underwrite debt service coverage against normalized FCFE. Run calculator output alongside projected debt service at current rates; if coverage falls below 1.25×, identify which operational fix — concentration reduction, margin improvement, capex deferral — closes the gap before application. The calculator anchors enterprise value; DSCR math determines whether the deal funds. Document trailing-twelve-month FCFE alongside EBITDA in lender packages so underwriting sees cash available for debt service, not accrual profit alone. That pairing prevents SBA declines driven by strong EBITDA on paper with weak cash conversion after inventory and receivables builds.